So, it is finally time for Streets are for People to hit the big leagues and achieve the goal we set for ourselves over three years ago. When we first started this ragtag group of data nerds and engineers, we had a goal to democratize useful urban data in the northeast Avalon and share our findings with the residents of our communities (and, of course, to have fun while we doing it).
At the top of our list of goals was the impetus to create a cost of service analysis for the entire St. John’s census metropolitan area which we’ve written about extensively. This was not a unique or special idea, but it is a modern concept that we have not seen applied to this area. So, what is a cost of service analysis? I’m so glad you asked (in my mind).
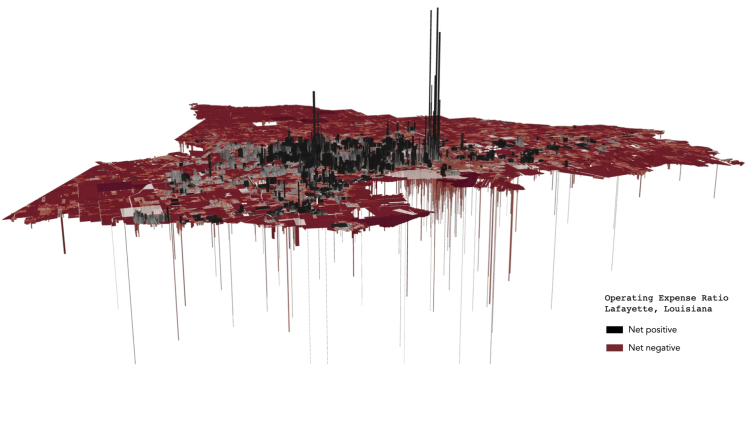
In simple words, a cost of service analysis compares the revenue generated by an area to the maintenance cost associated with that area’s infrastructure. The resulting figures show which areas of the city are generating more revenue than their maintenance costs, and vice versa. This is not a new concept — in fact my inspiration was seeing the work done by the group Urban3 in the United States. They are a consulting firm that does this professionally and at a very detailed level. The detailed level looks at maintenance cost of individual trucks, damage created by high volume traffic, taxes and loans, appreciations and depreciation’s of assets, etc.
We won’t be doing all of that.
However, if you’d like to see what our end goal will look like, below is an example of the expense ratios for Lafayette, Louisiana.
So, what will we be doing?
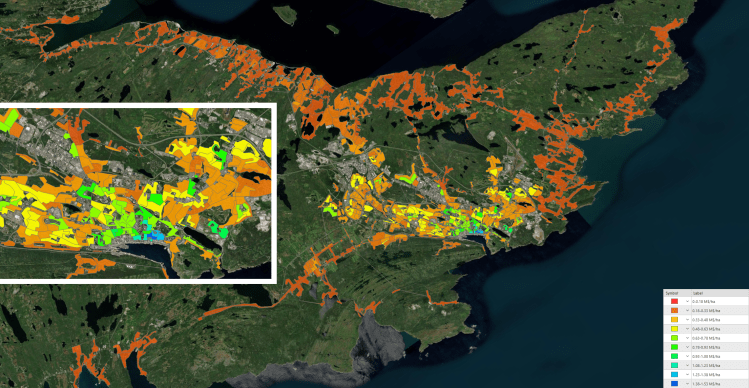
We will be doing a simplified cost of service analysis. In short, we will obtain tax assessment data of an area and compare it with its local infrastructure cost data to generate a ratio value based on the maintenance cost of that area’s local infrastructure. The maintenance cost of the infrastructure will be based on the physical infrastructure (pipes, roads, sidewalks, etc.), the approximate decadal age, and whether it is a high-use or low-use street. That is easier said than done but it is about as simple as we can get while remaining accurate and making sure the results are useable.
Our current infrastructure database already has the infrastructure cost information included. As for taxation data, there will be some extrapolation. We will not be looking at advanced economic functions of property appreciation, forecasts of economic outlooks, long- and short-term interest rates, or any of that. We’ll be taking a critical assumption that the maintenance costs will increase at the same rate as property valuation increases.
We have just acquired the taxation assessment data from the City of St. John’s, at great expense 😅. Our next steps are to combine the tax data with our infrastructure maintenance data. This will be an entirely new database built for this specific purpose.
What is the point of this?
Our task is to provide people with the information they need to understand the complicated dynamics of infrastructure maintenance in a simple way and to see which areas cost the city money and which areas make money. The goal of any municipality is to effectively maintain a quality of service from the taxes they levy from the businesses and people inhabit it.
Based on some preliminary research we’ve done a couple of years ago, we know what this database will generally show because we see it all over North America: The suburbs are subsidized by high-density downtown cores and mixed-use developments. At the end of the day there is simply no way a single detached suburban home can compete with multi-floor mixed-use residential and commercial buildings when they have the same infrastructure in front of them.
Our goal is not to lambast folks who live in the suburbs (a lot of us also live there!). However, we don’t want to see a city have to raise taxes just to fix what is currently falling apart underneath our feet. With this type of data want to create an informed public, so that the city’s decisions reflect what the people actually want. We hope to give people the understanding as to why we need urban infill, and higher density projects. We need these things from a fiscal standpoint, but we also need these walkable urban developments so that we can have a socially and environmentally equitable future.
I hope you are all as excited as we are to dig into this very interesting dataset. Our continued goal is to generate creative ideas for sustainable urban planning and this is our pièce de resistance of Streets are for People.
