Newfoundland has a demographic problem. Well, right now, the entire world has a demographic problem. But it’s been a problem here in the province for a while and the population has been acutely aware of it the whole time. Historic out-migration for economic opportunities and ‘brain drain’ have exacerbated the aging population crisis in an already rural and low-population region. To demonstrate what we mean by ‘demographics problem’ and ‘aging crisis’, let’s look at an animated chart. Plotted are the relative proportions of age groups among NL residents over time. Essentially, it shows how many people from each age category make up the population:

Did you spot the issue? It’s that thicker part of the plot, which starts off near the bottom around 1971 and slowly moves up, reaching the 65 to 69 years old category by 2024. That bulge is called the baby boomers. Since the above plot shows percentages, let’s add numbers for context. In 1971, there were about 62,000 infants and toddlers (0-4 years old), and 68,000 young children (5 to 9 years old) in NL. By 2024, there were around 19,000 infants and toddlers, and 24,000 young children. That’s 30% and 35% of the 1971 numbers, respectively. The only scenario in which this isn’t deeply problematic is if the overall population of the province in 2024 is also 30% of what it was in 1971. That, of course, is not the case: Population size was 530,854 in 1971 and 545,247 in 2024–a 3% increase.
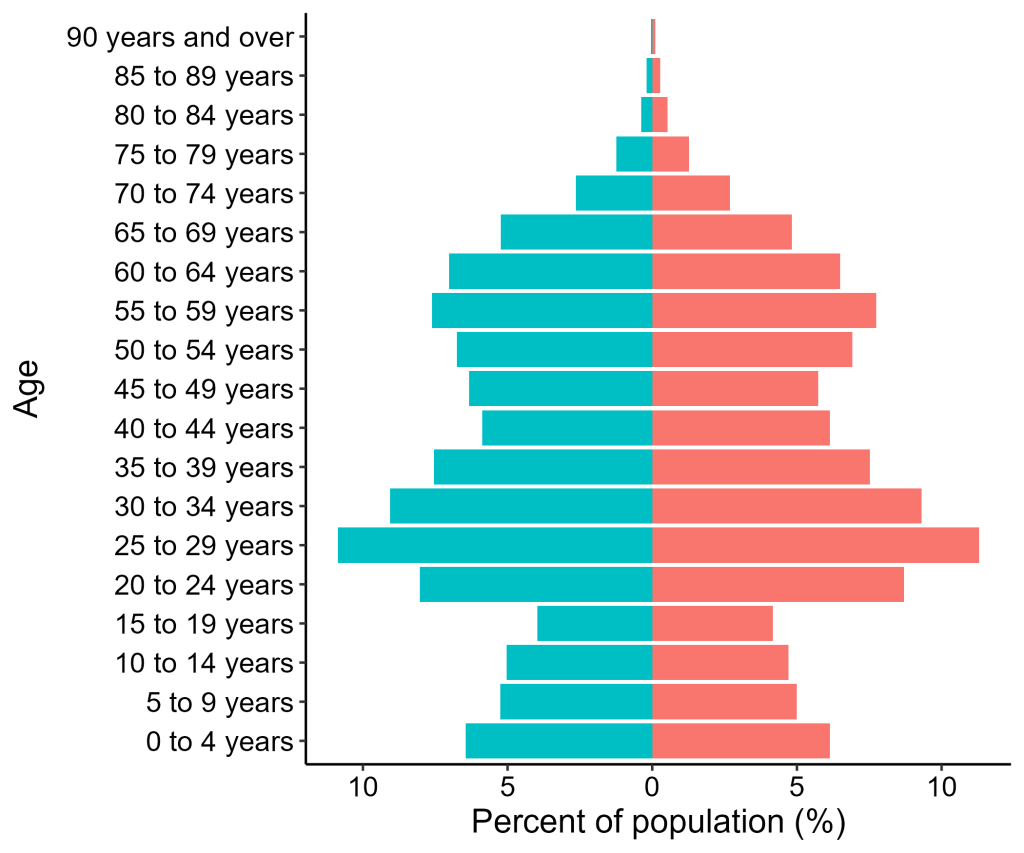
Why is this bad? Well, let’s pause that moving graph on the present day and take a better look.

As you can see, the age distribution looks like an upside-down pyramid. That’s what’s bad. The pyramid of a population’s demographics should look like a right-side-up pyramid, with increasing numbers of young people who eventually enter the workforce and can support the social security and infrastructure needs of the part of the population aging out of working years.
Not to mention, when a pyramid looks like the above, it indicates a population drop in the future, since people are not having enough children to replace the large number of older folks passing away. To show this, we plotted the ‘natural’ change in NL population over the last 10 years. ‘Natural’ change, in demographics terms, means the number of births minus the number of deaths each year among the people already living here (immigrants included):
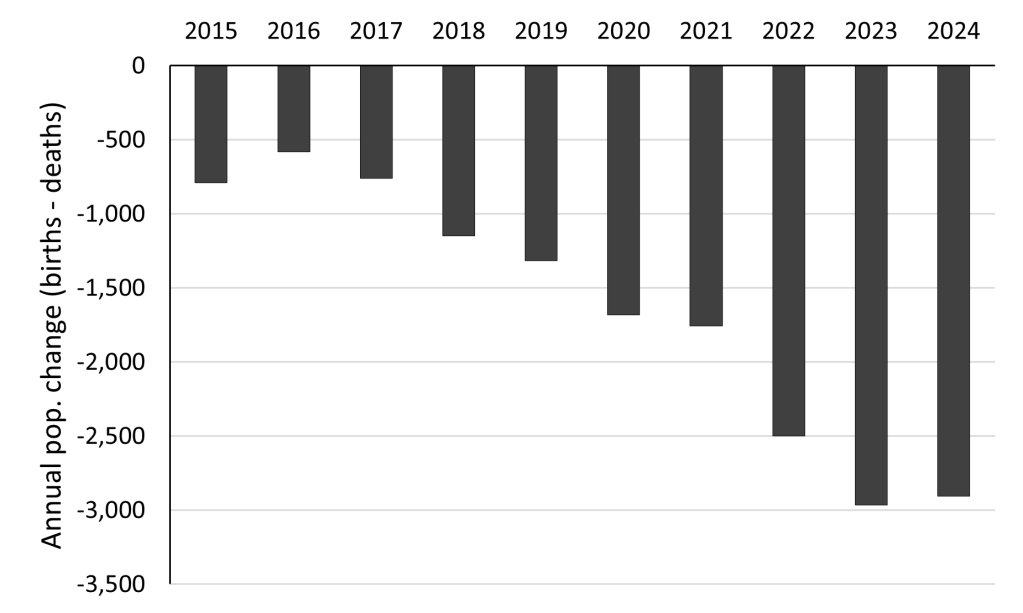
Grim. This issue around birth rates is a global, multifaceted one. In the case of NL, it’s made worse by young people leaving the province due to lack of opportunity. But regardless of how complex this issue is, we need people in the meantime for services, infrastructure, and social welfare to function properly. Which brings us to every Canadian’s favourite topic of the day: Immigration.
The quickest way to fix demographic issues of this nature is to bring in people — lots and lots of people. Since immigration can be targeted to younger people, the incoming demographic can help ‘balance out’ the uneven pyramid structure, essentially buying time for society to figure out a more sustainable solution to infrastructure issues (like the ones we love to talk about!). Can a sudden, large influx of people cause strain on the system? Absolutely. But that doesn’t change the initial reason for immigration policy, which is to sustain infrastructure and social security in the face of a demographic crisis. Immigration is a solution that comes with certain obstacles, obstacles that are much easier to navigate than a demographic crisis.
So is our solution working? We weren’t able to readily find demographic data for international immigrants coming into the province (but are working on it!). However, good news, we’ve had net positive inter-provincial migration over the last 4 years and we did find demographics of those migrants. This pyramid represents the age distribution of people who have moved into NL from other provinces since 2020:
As you can see, there are lots of promising trends here. Compared to the 2024 pyramid of NL’s population, many more young people are present, especially young professionals and college aged people. Now, these interprovincial migrants make up less than a tenth of international migrants over the same period, so take this initial tid-bit with a grain of salt. Our hope is that we’ll see similar trends in the international migrants data, and we will update you when we do! Through immigration, we can maintain infrastructure and social security while moving into a more vibrant future in which ideas and identities will be more diverse. And one, we hope, where streets will be for people.
