They say that when it rains, it pours. When you already have it bad, you tend to be more affected by further misfortune. Of course, any state that is functional should have levees in place for when the rain gets bad. But is that actually the case? Earlier in the year, we shared a novel policy tool for quantifying the affordability crisis: Affordability maps. The aim of these maps is to provide key decision-makers with accurate and detailed geospatial information to tackle the affordability crisis. Over the next few months, we will dig deeper into 2021 census data for the North East Avalon region and look for patterns in the data that indicate who is most affected by housing insecurity. It’s important to identify which demographics within the population are affected by an issue so that solutions can be targeted to that population.
In the first post of this series, we wanted to explore how housing insecurity interacts with income inequality and citizenship status. Obviously, people who have lower incomes feel the effects of inflation more intensely. However, when it comes to housing, people also generally live somewhere that is within their means. That is, low income people don’t actively seek housing in rich areas. When cost of housing goes up, then, it should affect various neighbourhoods according to their own income-level (e.g., the cost increase in rich areas should be higher than the cost increase in low income areas because of the difference in property value and shelter size). When cost increase disproportionately affects people with lower incomes, it’s an early warning sign that social security nets are beginning to fail. Similarly, the presence of non-citizen residents or immigrants in an area should not interact with affordability in ideal conditions. To assess whether income inequality and citizenship status interact with affordability, we conducted analyses across each dissemination area (DA) in the North East Avalon region of Newfoundland and Labrador.
In the plots below, ‘shelter cost’ is calculated within each DA by dividing the median cost of owning or renting a shelter with the median income of people within that DA. This measure controls for differences in income and any effects that appear are above and beyond the variation in income across regions.
Low Income Measure
The Government of Canada calculates a low-income measure each year for social security reasons. This measure determines how many households in a given region earn less than 50% of the median Canadian income. Since we only have housing cost data from the 2021 census, we used the low-income measure for that year. In the table below, we summarize some of the low-income cut-off values for 2021 according to household size:
| Household size | Annual after-tax income ($CAD) |
|---|---|
| 1 | 29,206 |
| 2 | 41,471 |
| 3 | 50,587 |
| 4 | 58,413 |
We determined rental affordability across the DAs in the region and correlated that with the presence of low-income households in each DA (as a percent of all households in the DA). While we also performed these analyses for cost of owned shelters (see appendix), we are presenting cost of rented shelters because people in precarious economic circumstances tend to rent rather than own a place.
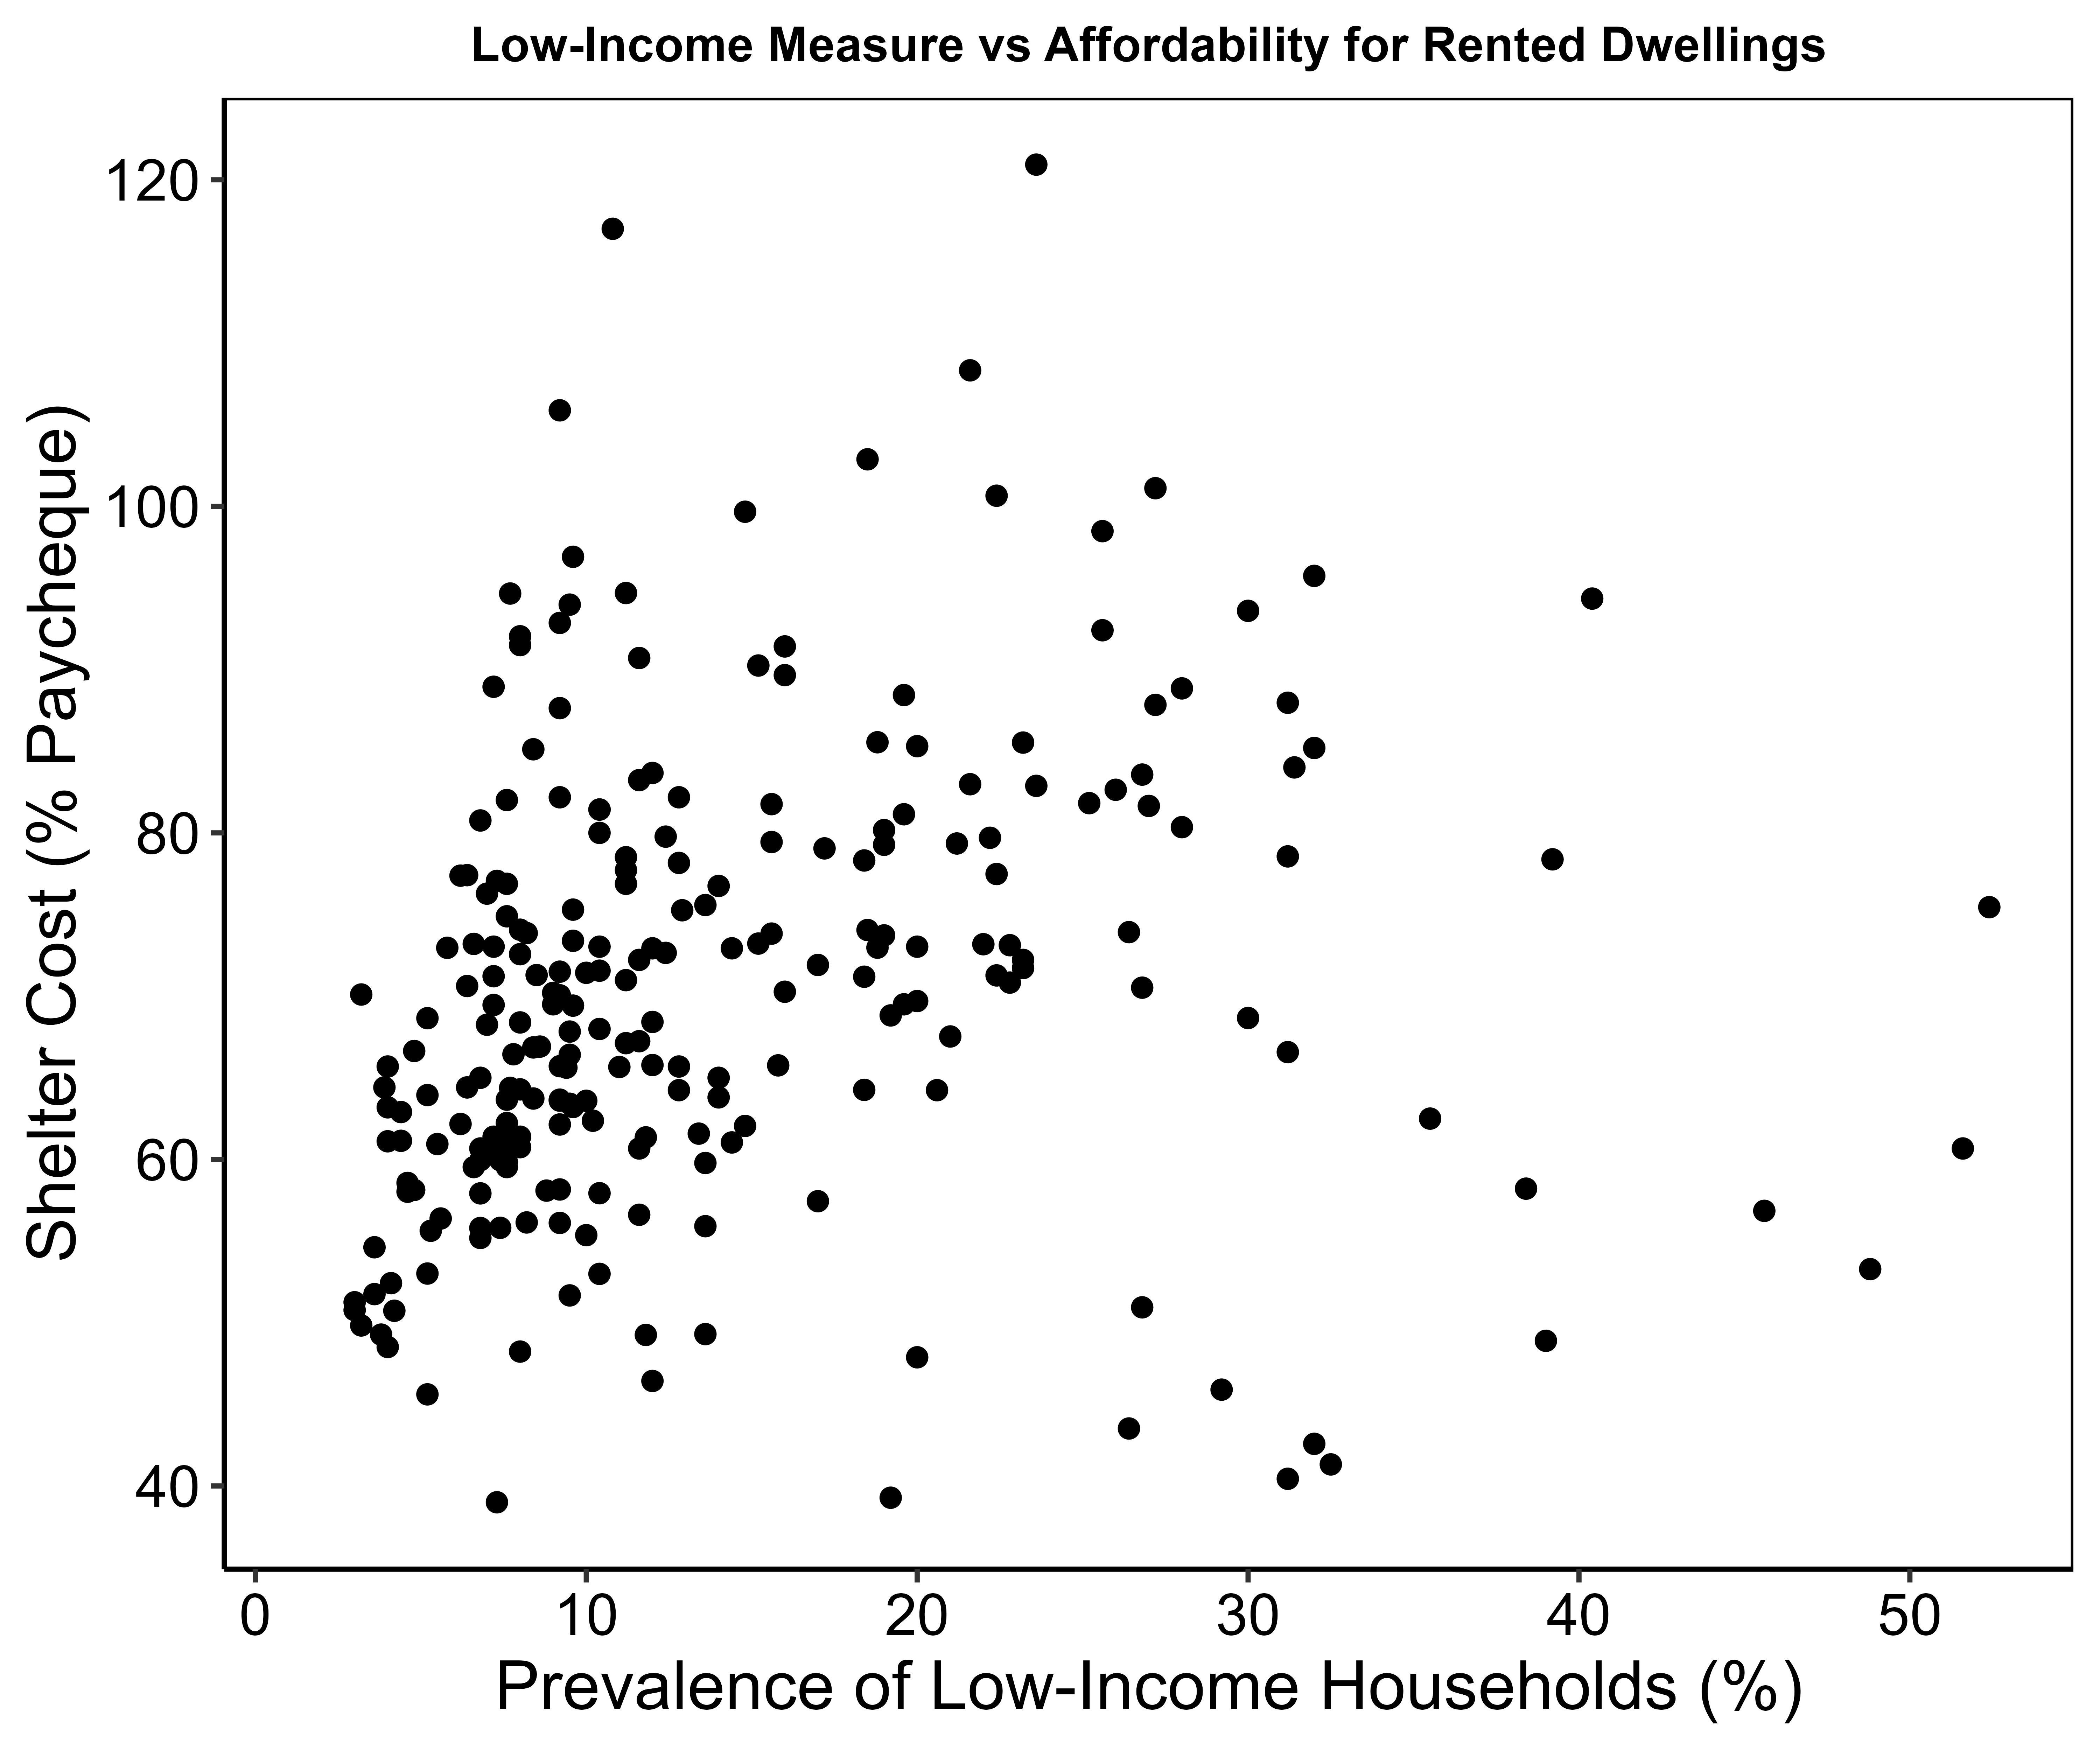
If affordability was purely caused by lack of housing, income-adjusted shelter cost (what we are reporting on the y-axis here) should not correlate with the prevalence of low-income households. In the above graph, that would look like a fairly even spread of dots in a vertical column-like spread. Instead, as you can see, there is a notable skew to the right as you go up, which is a cause for concern. This means that in areas containing more low-income households, rented shelters are harder to afford.
Gini Coefficient
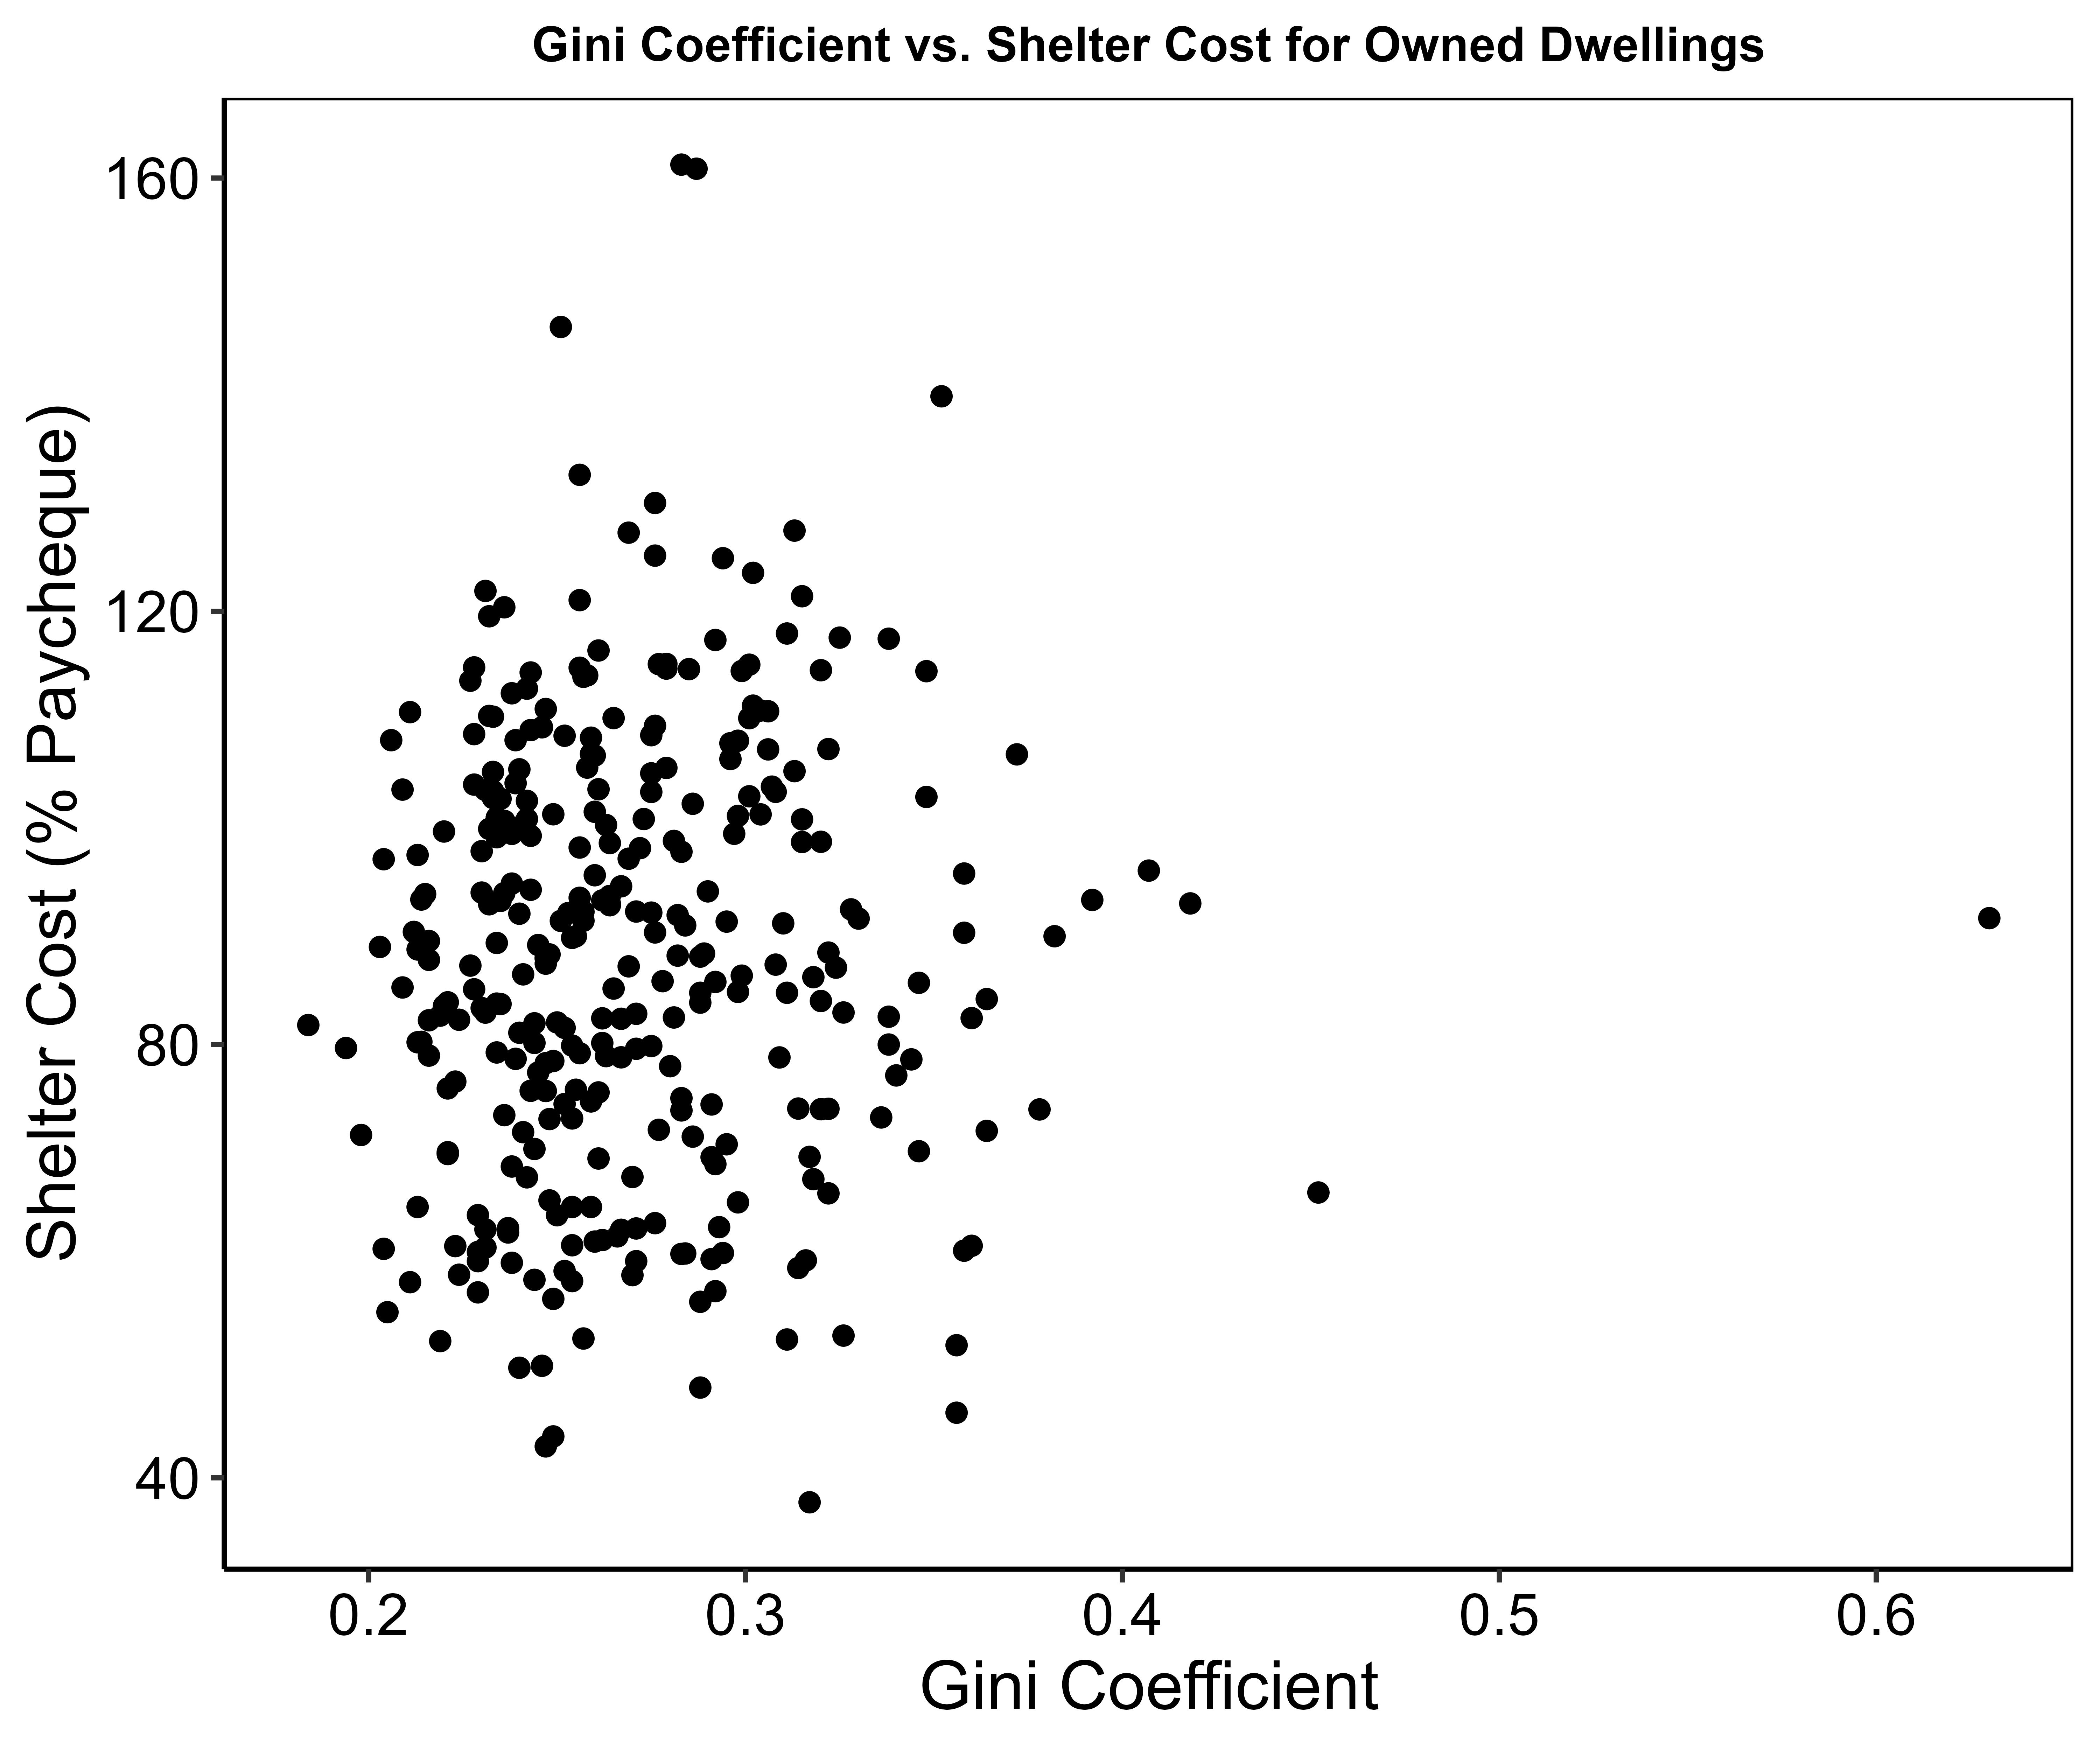
Next, we plotted the Gini Coefficient against affordability. The Gini Coefficient measures the extent of economic inequality within a region, with 0 representing perfect equality and 1 representing maximal inequality. This measure is calculated by Stats Canada for each census year and for each DA. The higher the measure, the more inequality there is within the DA.

While the effect is not as notable as the low-income measure, we still see a clear skew to the right, which is once again a cause for concern. The more economic inequality that a DA has, the more its residents are affected by shelter cost, indicating that economic inequality exacerbates the housing affordability crisis. It’s also worth mentioning that we did not remove that outlier point that has a Gini coefficient greater than 0.6 because it does capture meaningful economic inequality within that DA, which consists of a mix of regular-sized houses and sprawling mansions.
Unemployment Rate
Unemployment rate is another measure of economic precarity, as regions with higher unemployment rates tend to be more affected by cost increases. In addition, lack of employment could potentially underlie the greater shelter costs we saw in previous analyses. To investigate further, we plotted each DA’s unemployment rate against its rental affordability:
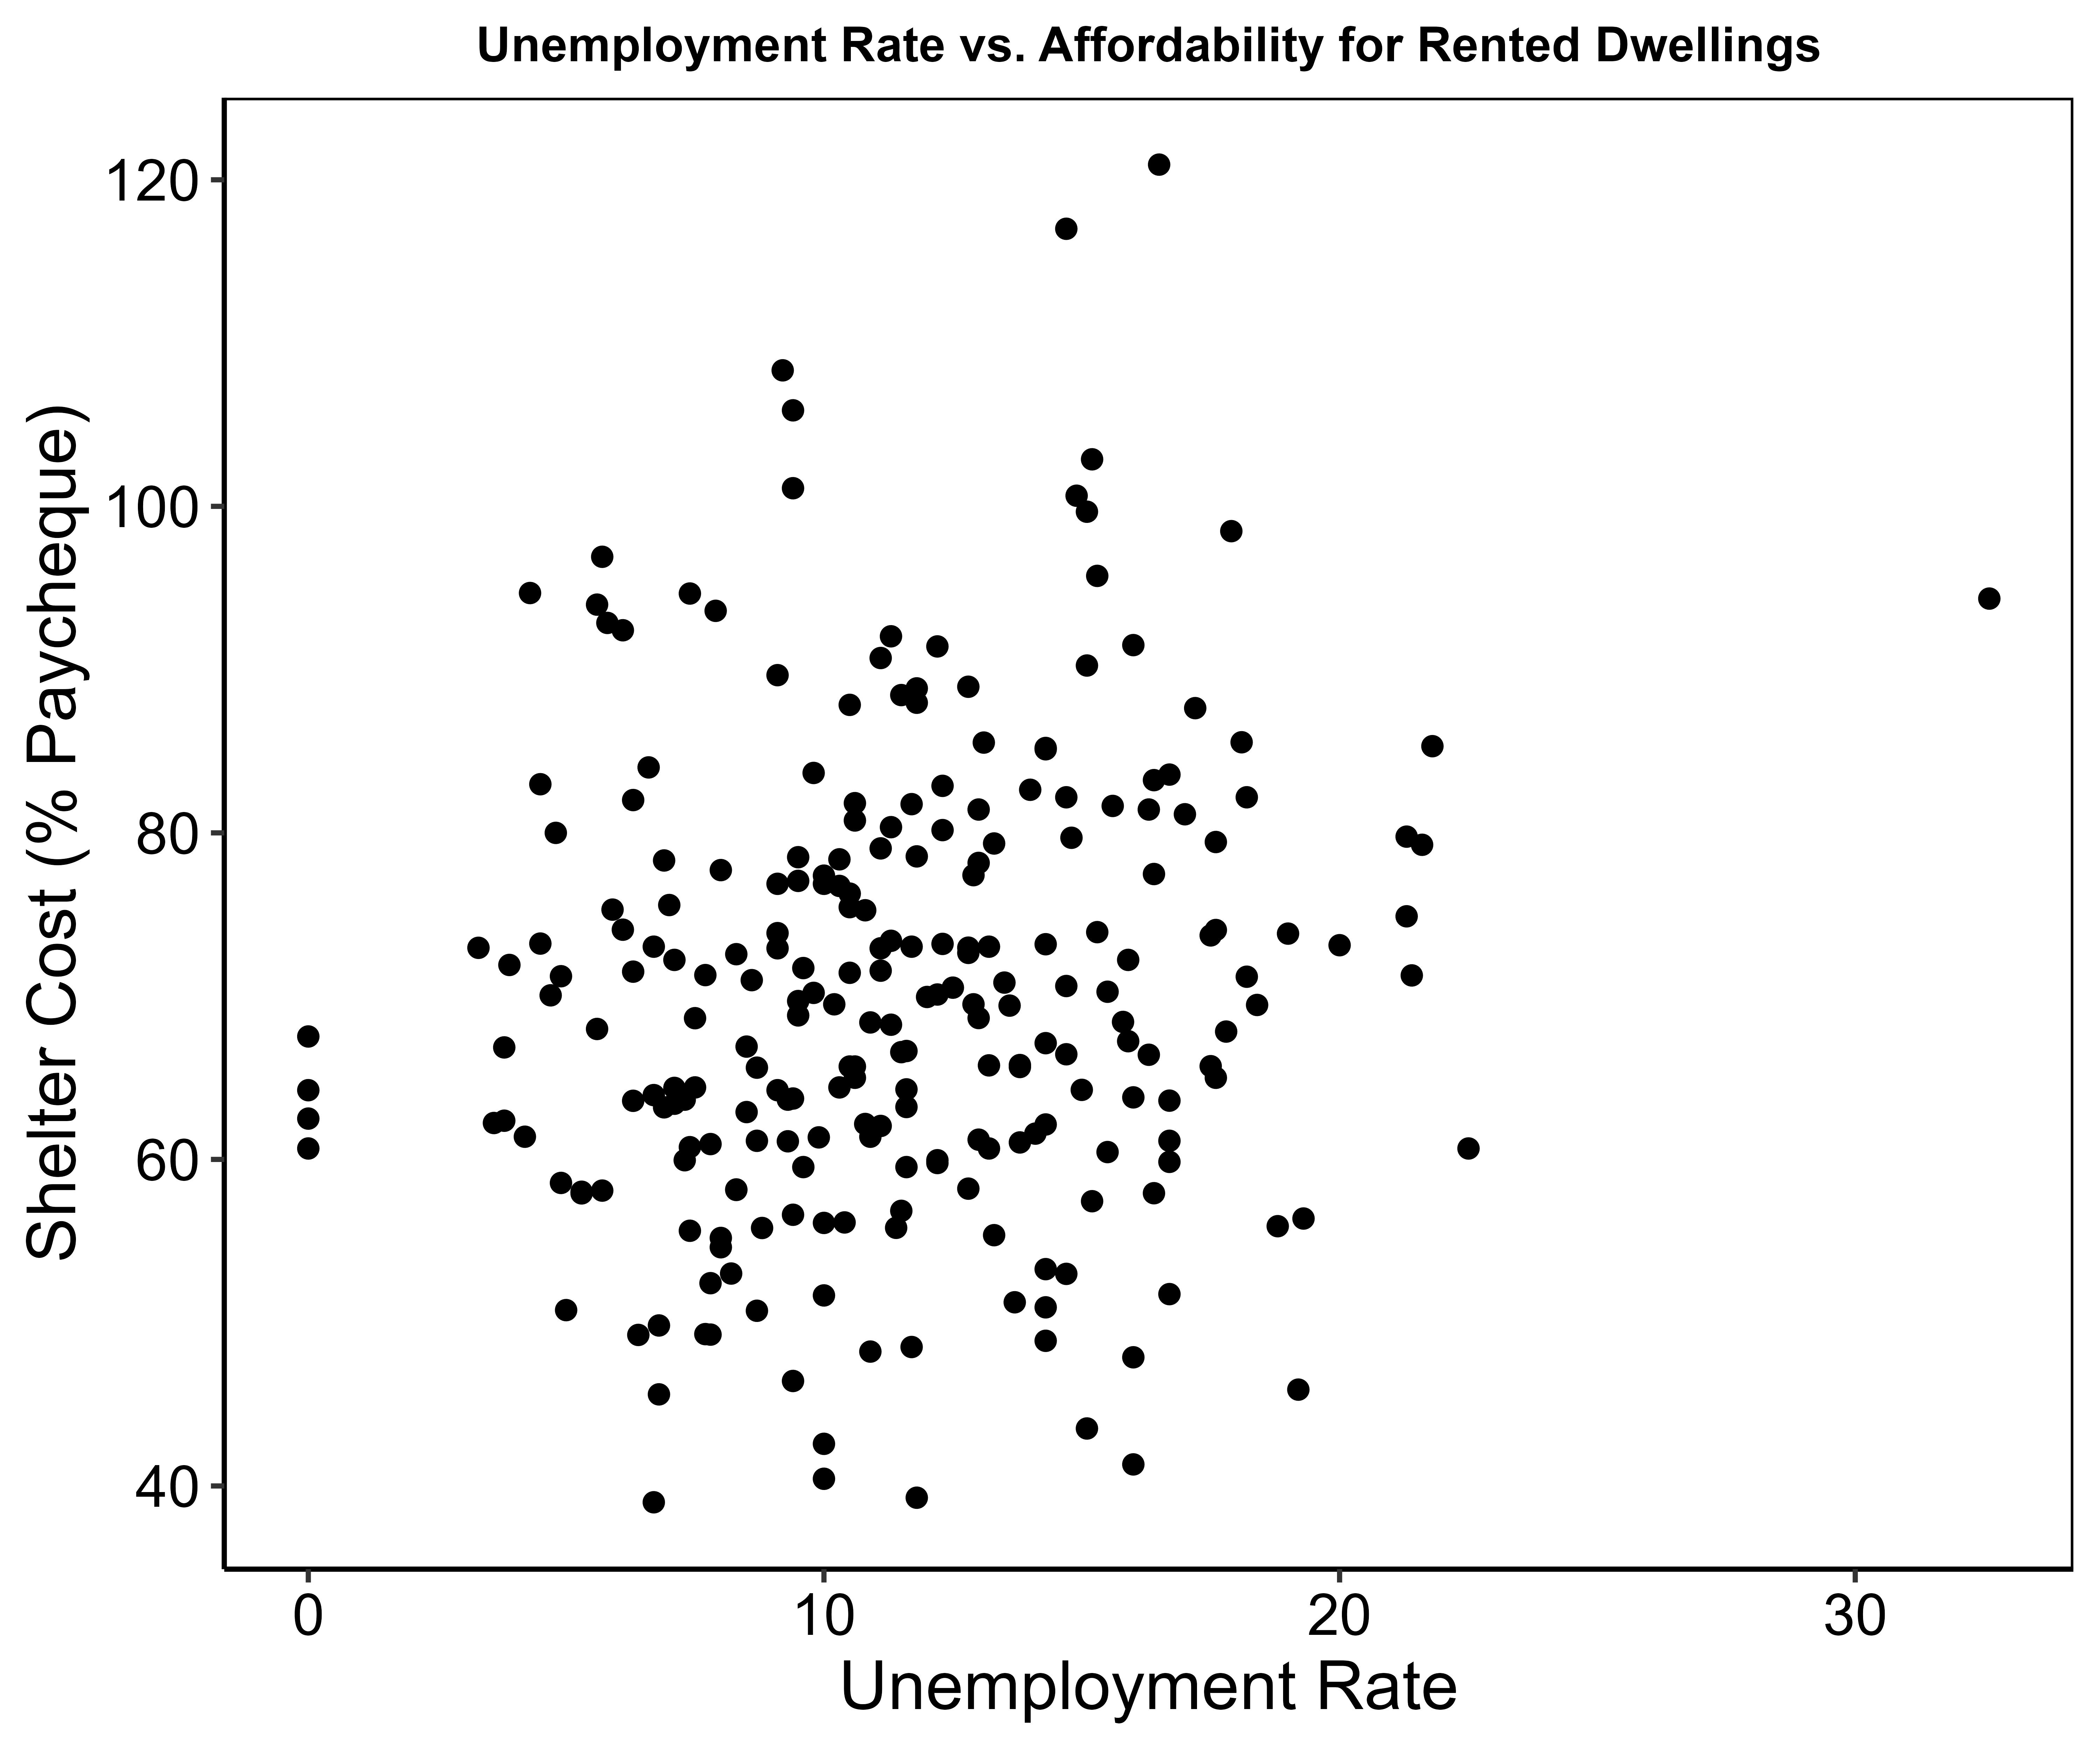
Unlike the low-income and Gini analyses, we did not see a clear relationship between unemployment rate and affordability. This finding is meaningful, though, because it indicates that it isn’t the lack of employment, but rather inequality in income distribution, that makes affordability worse for lower-income households. While this difference may not be significant to laypeople, it’s an important distinction to take into account for policy- and decision-makers.
Presence of Non-citizens
A liberal democracy should aim to treat all residents equally, including non-citizens. Stats Canada defines it’s ‘not citizen’ measure as residents who were either permanent or non-permanent residents at the time of census survey. We plotted the presence of non-citizens in each DA against affordability of rented shelters:
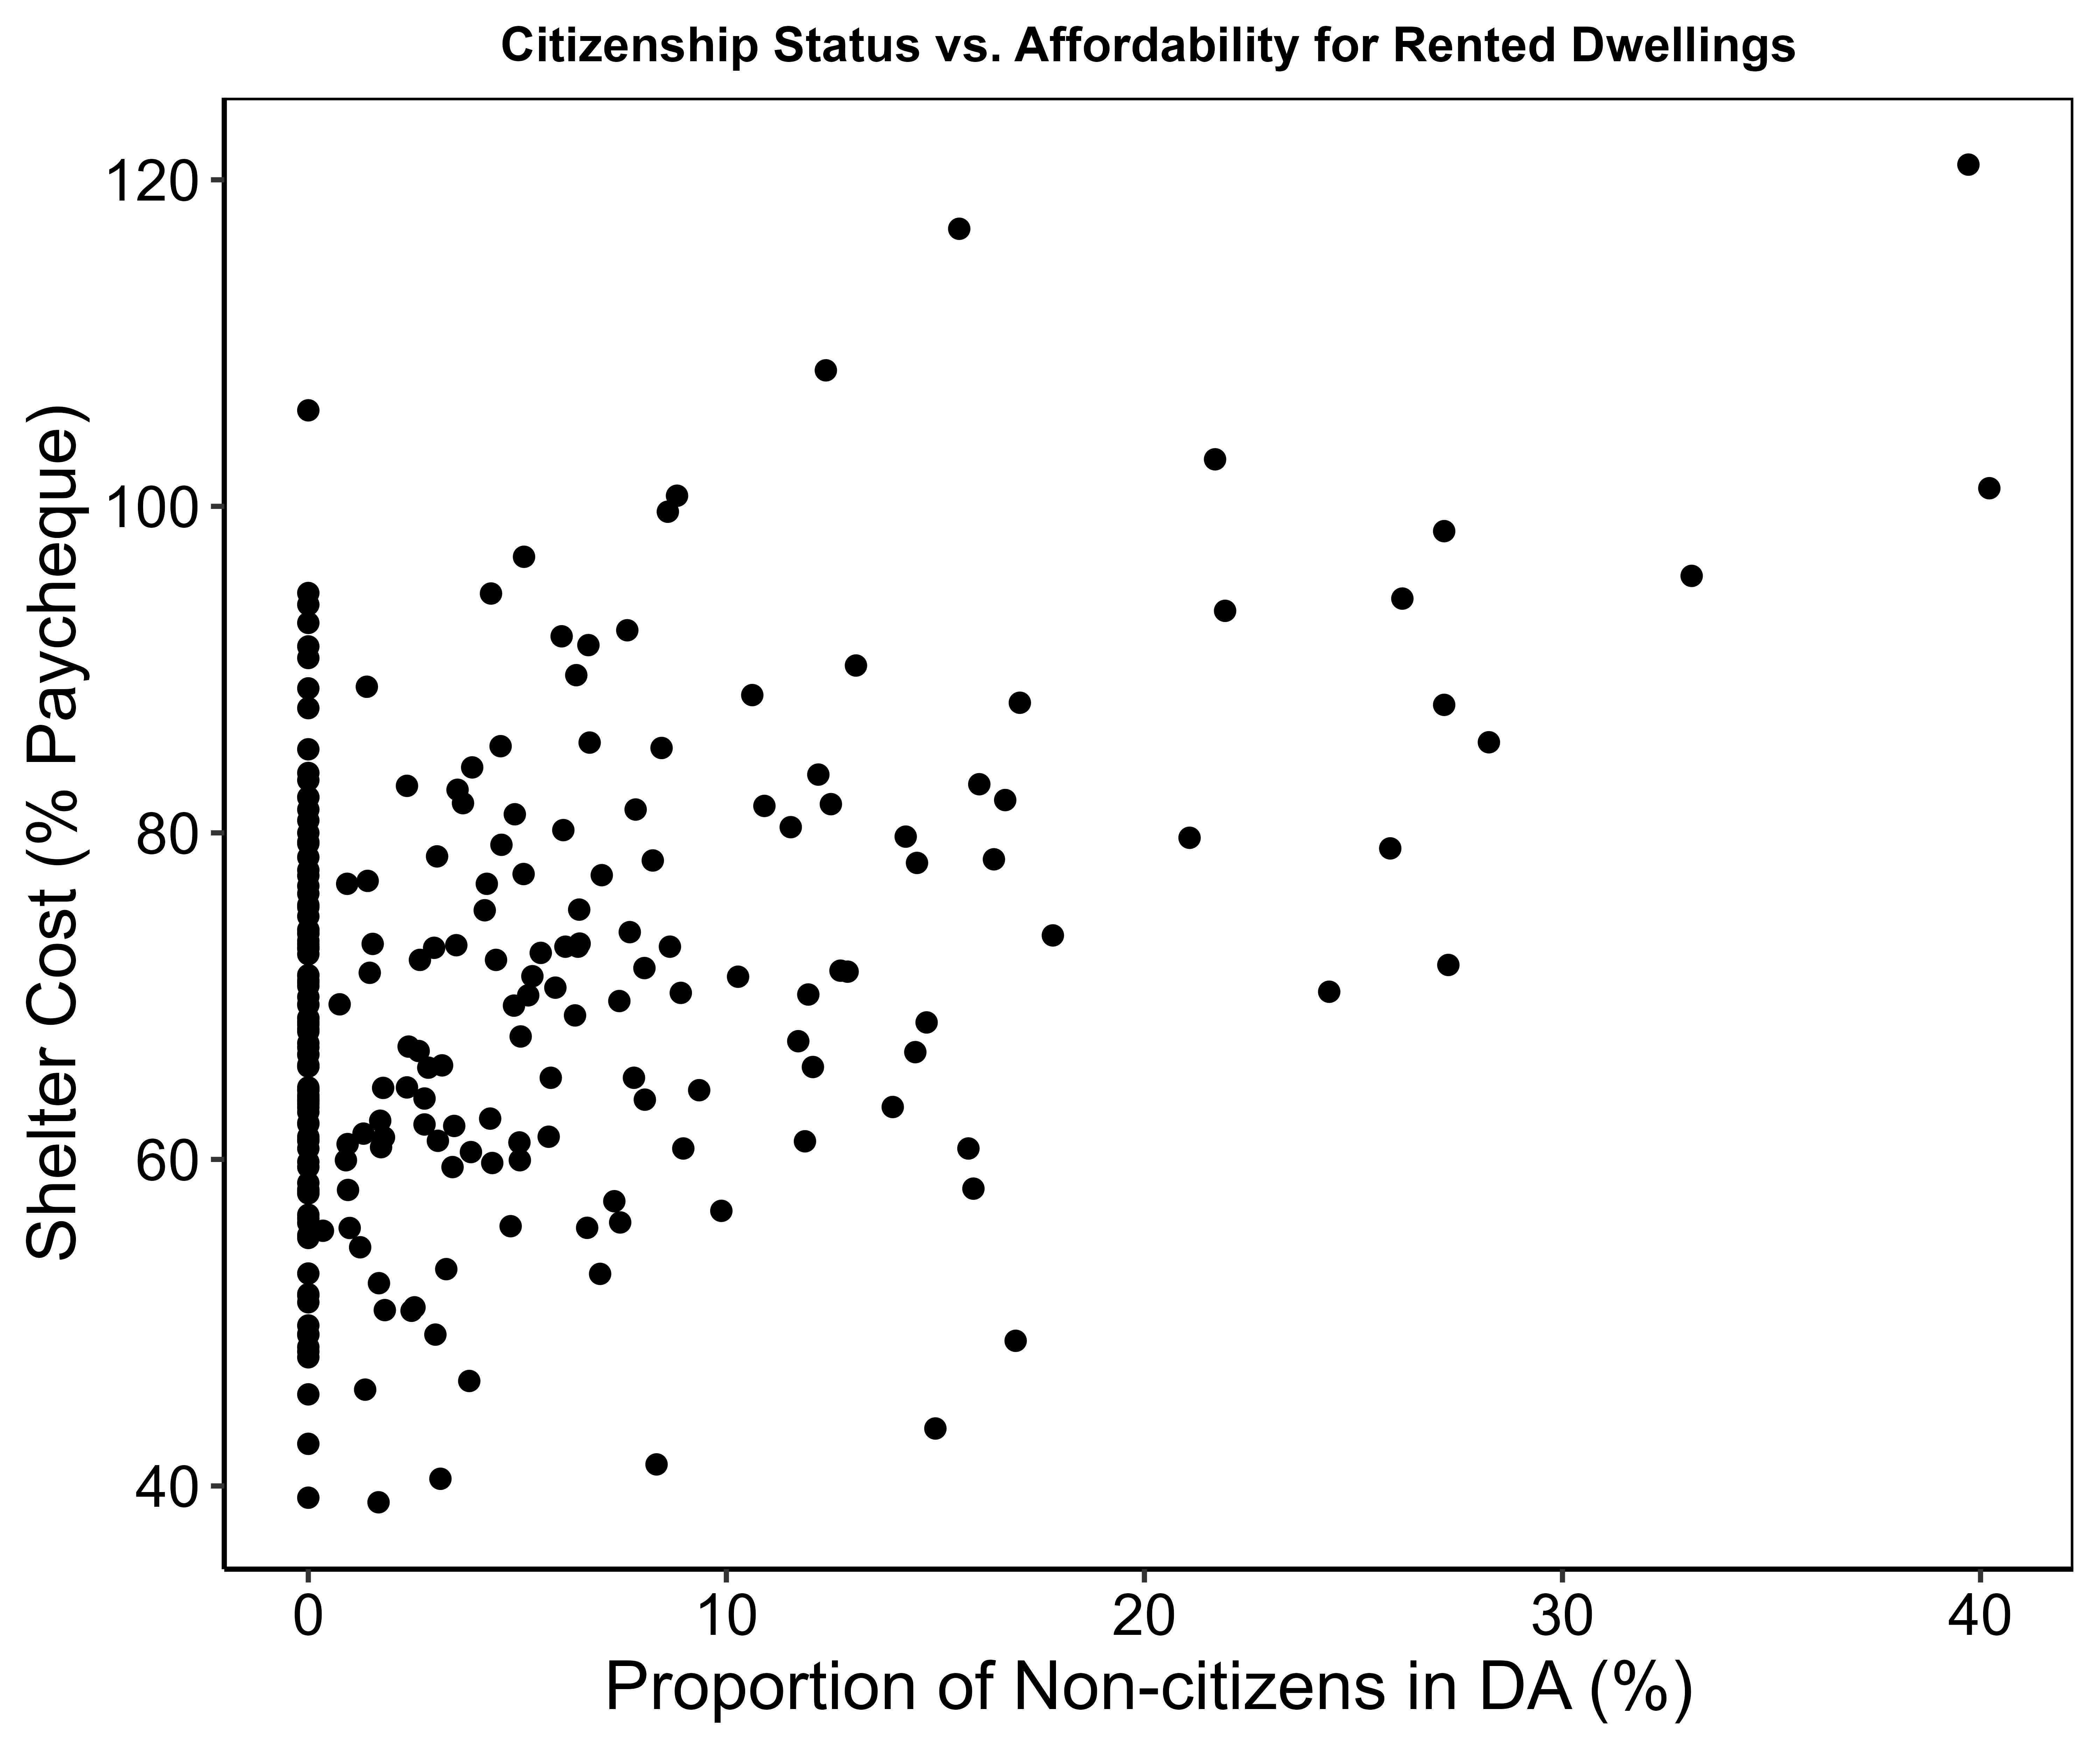
While many DAs do not contain non-citizens (all of the points at 0), we see a clear pattern where a higher proportion of non-citizens in a DA correlates with higher shelter costs. These findings indicate that non-citizens are disproportionately affected by housing insecurity. As a disclaimer here, this may be an expected finding because the increase in employment opportunities is heavily advertised as an incentive for residents to achieve citizenship, so it makes sense that without citizenship, people struggle more economically.
Presence of Immigrants
The immigrant measure is defined as persons who are, or have ever been, immigrants or permanent residents. This includes the portion of the population that are citizens now but were immigrants before. In ideal circumstances, this measure should not correlate with shelter costs, alas:
In contrast to the non-citizen analysis, we should not expect a relationship here as non-citizens should make up only a small portion of the immigrant population. Unfortunately, there is clearly a relationship between the presence of immigrants and shelter costs, where relative shelter costs are higher in areas where more immigrants are present. This finding reflects poorly on Canada’s perceived image as a bastion of immigration and indicates more dysfunction of social security nets.
Conclusion
Economic inequality is a major hot-button topic in the 21st century, and rightfully so. As wealth gets concentrated in the upper 10% (and increasingly 1%) of the population, the majority of residents are struggling to make ends meet. Infrastructure issues, such as lack of housing, exacerbate the struggles of much of the population and, as we showed in this post, disproportionately affect those that are already worse off economically. Liberal democracies that pride themselves on strong social safety nets, such as Canada, should strive to account for these inequalities when proposing solutions to society-wide issues. After all, social security nets, like streets, are for people.
Appendix