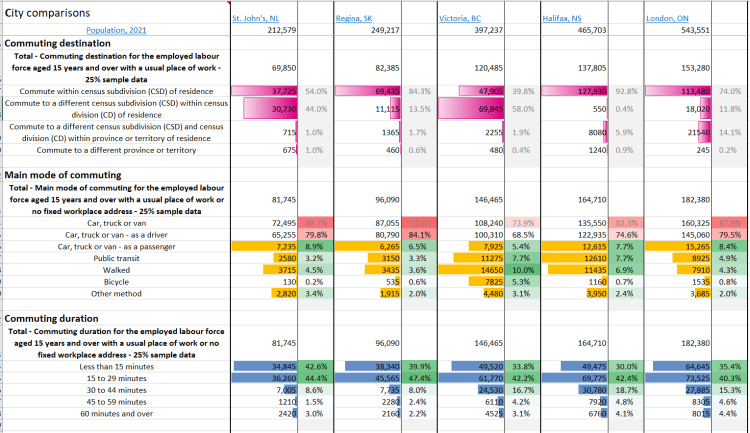
St. John’s: One of the most car friendly city in Canada. That might not be true according to many articles you’ll find on the internet, but the statistics are there. People here LOVE their cars and just can’t get enough of them. Below are some of the statistics for St. John’s and its peer metro regions in Canada. We are pretty much as car-y as you can get. We have the highest less than 15 minute commute time out of our peers. We also rock the 15-29 minute as well. Pretty good if you love driving. If you need to commute, CSJ has the shortest times.
Then look at total driver numbers 79.8% of us commute as a driver of a ‘car’. Only Regina beats us in some peers.Compare that to Victoria where only a paltry 74% of people drive a car to commute. Rookie numbers. Come back when you are almost 90% in a car! However we do have a good few people sharing cars with the highest commute as a passenger of our peers. Blegh!
Try and get a less than 45 minute commute in Calgary, Toronto, Vancouver, or Montreal. Ignore that they all have fantastic public transit so you don’t have to drive. Ignore that those people can save ten thousand dollars a year on car ownership per car. No… come back! I want to sell you the new Ferdevy F2500 crusher king warlock edition with 6% ARP and only 8 years of $800/mo payments and a $100 gas card that isn’t even a weeks driving! Come back!!!
Enough Jokes, get back to data
Onto the real point of this post, which is discussing people who do NOT use a vehicle to commute to work as a driver or in a car at all. The data in this post is all from our friends over at Statistics Canada. They don’t track people’s mode of transportation of choice for non-commuting so we will have to draw some conclusions from the data we have. This data also doesn’t get into why they don’t use a car, but future mapping data should help illuminate that data (previews are in this post and hint hint, it is transit and walk-ability to services)
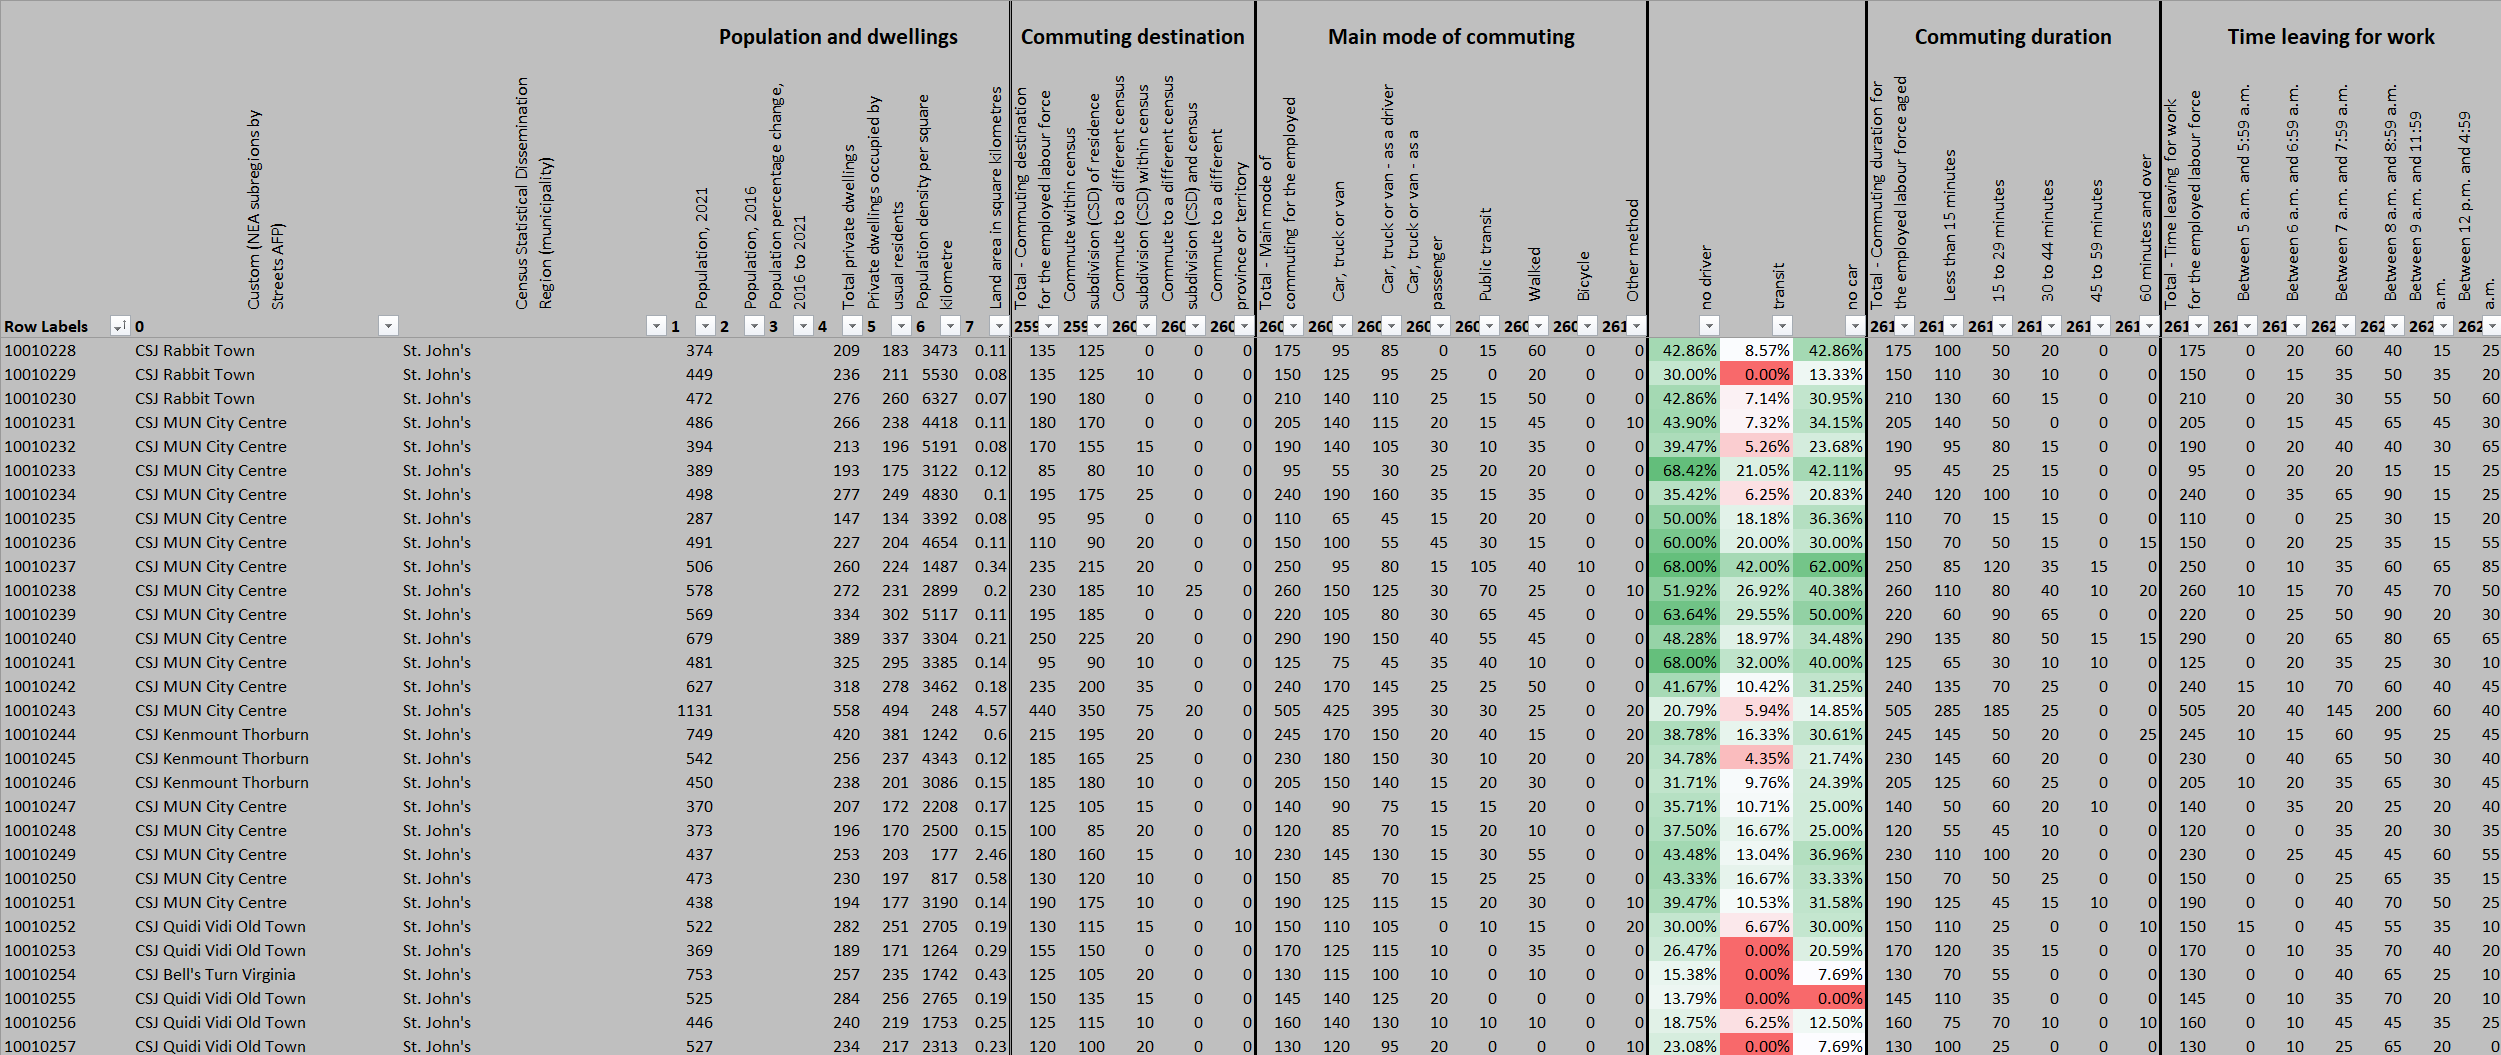
So above you can see that ‘St. John’s NL’ has a population of 212,000 in 2021. That is not correct because that is not just St. John’s. That is the St. John’s CMA, or Census Metropolitan Area. That is the region the federal government deems is regionally dependant and functions as one municipality. It is made up for 14 communities that include Holyrood and Witless Bay. So instead, lets look at some communities around the North East Avalon (St. John’s CMA).
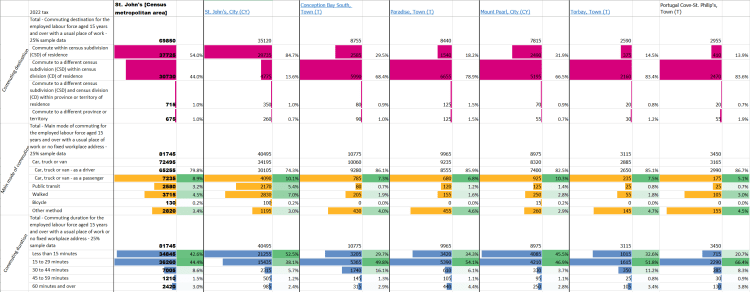
Now there is more data tucked away in that spreadsheet, but we don’t care about that right now. Those are many future posts. What we care about in the above is the breakdown of people who are not commuting by car. What we can see is that sure, the entire region is 80% of people driving a car to commute, but St. John’s itself is only 75%, with the suburbs making up the army of 85+%’s.
When we look at the remainder, you can see that 9% of the population are in a car, they just aren’t driving a car with St. John’s topping that at only 10%. That is a decent amount of carpooling, but without more data we cannot say if theses are friends, co-workers, or spouses/family. Also when I say car, I simply mean a large class motor vehicle capable of highway speeds.
Continuing into that data, we see that walking and transit, make up around 7% of the population in the whole CMA region, but St. John’s is over 12%, or around one whole Grand-Falls Windsor of people not using a car at all. The suburban towns plummet down to 2-3%. This makes sense when you look at the basic tenant of walk-ability: walking infrastructure and places to walk.
Also of note is the commuting destination. 85% of St. John’s residents stay in the city to work, whereas pretty much everyone around has about 2/3rds leaving their community to work. That isn’t 100% of people heading to St. John’s but it does show that majority of people in the suburban communities don’t stay there to work. This is obvious when you see other statistical data that will also be future posts.
Maybe you are thinking “Well I live in Cowan Heights and work in Donovan’s industrial”. Sure. Mount Pearl is also a large driver of employment in the region so St. John’s is just too big. You want to get down and close with the data. You want to know how your neighbourhood commutes. Well, good old Statistics Canada comes in again with their census dissemination areas. These are little chunks of 400-1200 people that are statistically relevant that are all over Canada. Canada is split into tens of thousands of these,
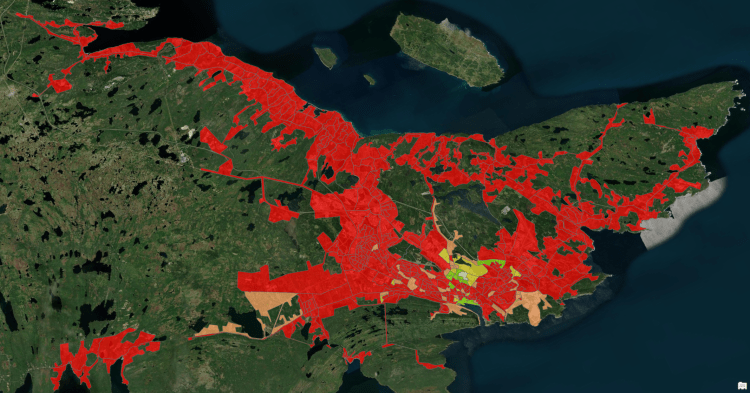
The St. John’s CMA is made up of specifically 337 of them. Places like Pouch Cove are made up of 3, and St. John’s are the lions share. This allows us to look at specific pieces of Stats Canada data to dig really deep into mapping that shows that data. So if we pop people who don’t drive a vehicle to commute into our mapping software, we get a map like what is below.
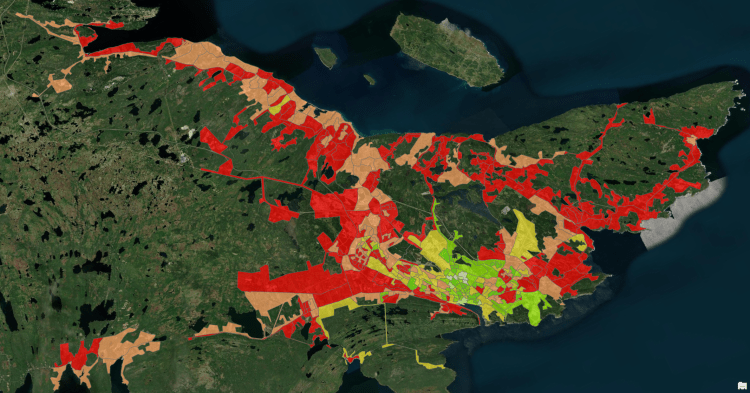
In this image above, it has been automatically coloured to highlight people who are commuting and NOT driving a car themselves. This is those who carpool. A lot of these are likely family/friends as the ‘bedroom suburbs’ have pretty decent carpooling numbers. Included in this is also transit users, walking, and the itty bitty number of those who cycle.
The oranges are still not high, they just might be around 20%, instead of 5%. No areas aside from downtown and around MUN have more than 50% people not driving a car themselves. What you can see though, is that in select areas, there are some people not driving a car to commute to work. In towns like Conception Bay South, which has no bus aside from private seniors home buses, commuting is almost guaranteed to be in a car even if you aren’t driving. You will see this is later maps when we remove cars all together.
In our current internal database, we have housing affordability and Metrobus Transit data as well. A thing of interest in the map is that even though the route 2 and 3 run fairly regularly on the east end of St. John’s there is basically no-one outside of a car even for carpooling. There is almost a direct correlation between housing value and income, and the commuting method. Again, the information in Statistics Canada doesn’t get into that level of information. That is something we will dive deeper into in a later post.
A great quote to keep in mind is this: “A developed country is not a place where the poor have cars. It’s where the rich use public transportation” – Gustavo Petro, former Mayor of Bogotá. Most of Canada does not fit that bill. We are closer to our neighbour to the south than our European and Eastern Asian counterparts.
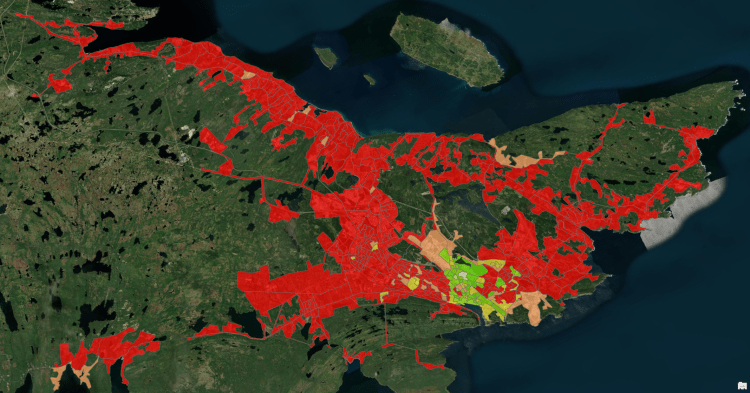
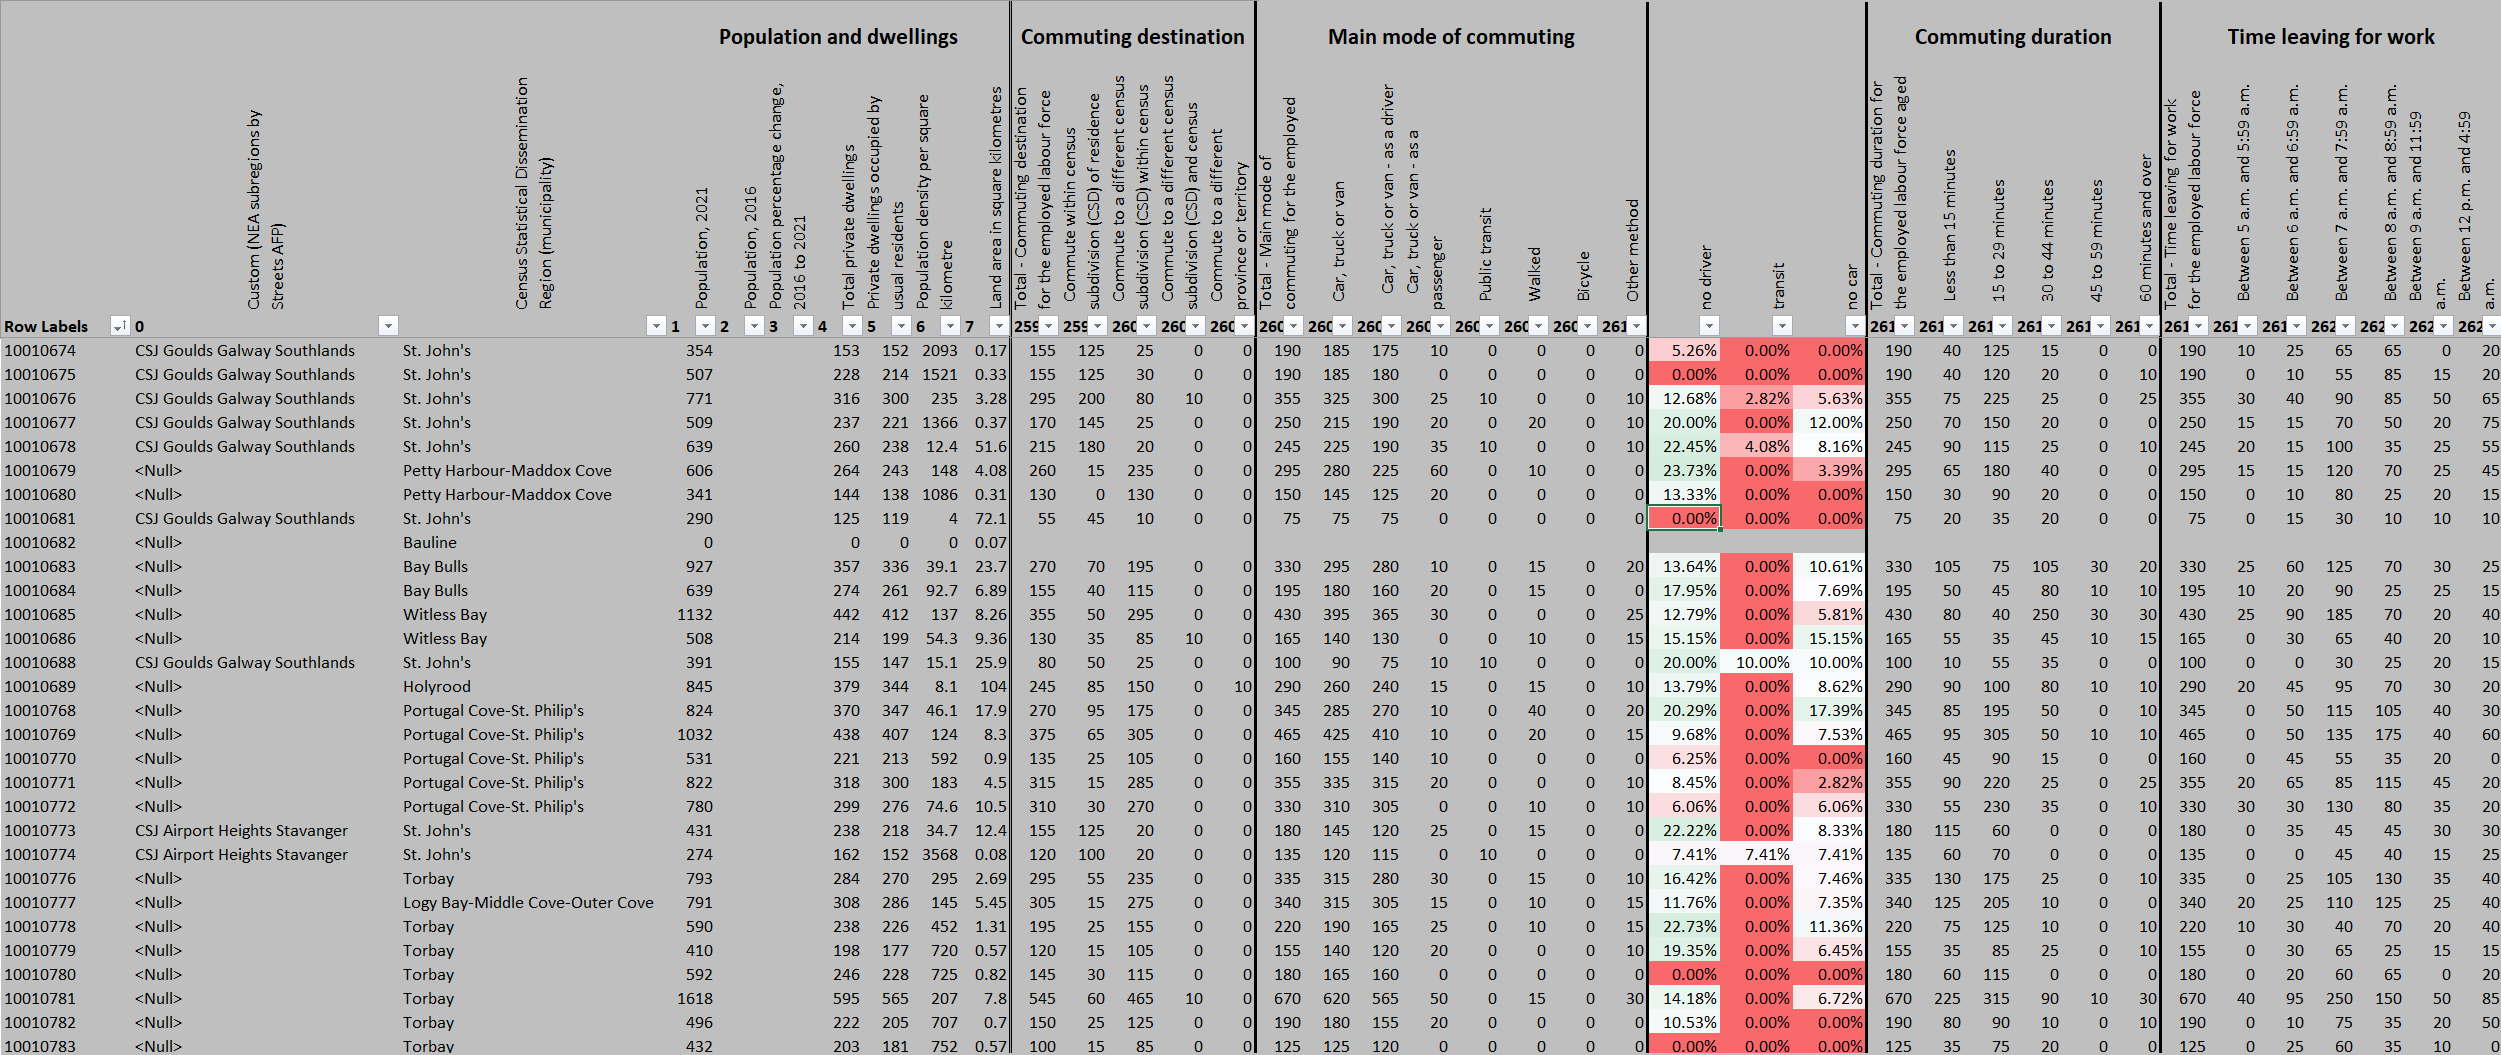
Now let’s move onto no car at all. This map is for folks that do not use a car at all as their main mode of transportation for commuting. In this map, as seen above, areas around the major transit hubs, areas with large seniors homes, and on Metrobus core routes are the highest counts of non-car using commuters. There are some anomalies that I cannot fathom exist. These are still small percentages of 10-15%, but they are there regardless. Witless Bay and Portugal Cove have a single area each where there is a well above average. There doesn’t seem to be a large number of jobs, walking infrastructure, or seniors homes in the regions, so these might be errors in Stats Canada’s data, or just some secret haven for even the most minor of car-free commuting.
There is a large taboo with taking the not having a car. We could probably analyze the data to see what income triggers people to suddenly think spending $10,000 per year per vehicle makes sense, but distance to places of employment certainly are a factor that must be taken into consideration. This speaks volumes to our local social pressures than economic literacy, though even I must admit that to go car free in the region is a sacrifice in time, even with the money savings. That must change for a city to develop. We cannot continue urban sprawl as it is unsustainable fiscally, socially, and environmentally.
Next up, we have the bus only. This really drops off to just the MUN and downtown core of St. John’s. There are a few small spots in Mount Pearl and St. John’s that are not within that area, and they generally have more apartments, and seniors living in the area. This is some analysis we could perform at some point, but again, the demographic data about commuters isn’t tracked in a publicly available manner so any mapping would simply be conjecture on our part. Though we are having fun in these posts, we still want to be accurate.
The scales in these images aren’t really important. Just know that red is low and green is high, for each use case of commuter mode of transport. They are green the higher the use case. They could be coloured by quartiles, standard deviations, even splits or any myraid of statistical tools. For now, the colour is all that is important. When this mapping data is interactive and public, we will discuss the different methods of statistical analysis that we used.
As we get into more granular analysis of Metro St. John’s, we will be doing a lot of math on these little chunks of St. John’s. There are even smaller regions but the nature of Stats Canada’s survey method means these smaller areas are less likely to have a high number of actual long form surveys, and thus the data gets less accurate. The probability of these larger 300-1200 population blocks having actual long form Statistics Canada surveys is much higher than the smaller 50-200 population sub-chunks. See the previous post to understand that word soup you just read.
A thing to note is we have modified the regions. We have not made them larger, or overlapped them, but we have changed them to better reflect the actual built-up regions of the metro region. With our modified regions, we could also gather data on population density, commercial density and more. For population statistical data, we don’t really care about trees or lakes.
All that said, below is a comparison of some different parts of the St. John’s CMA. You’ll notice that no-one rides a bus where it doesn’t exist (the suburbs), but where it does, people do (MUN core). There is other neat data in there you can poke around at. This is all public data, just processed internally for GIS work. If you want this data, just send us an e-mail and we can provide it. It is a big ol’ spreadsheet.


If you want to get a bit more into the data yourself, here is the tool that you can use to extract that data. If you are really interested in diving deep, we can provide the source data, just feel free to reach out to us via our contacts page. The data we process is sourced from publicly available data. The way we view and analyze that data though, will always have some biases. Some things we cannot share, due to agreements with government organizations, but we can help anyone explore the data for their own means. For example, finding all the codes that represent the Statistics Canada Dissemination Areas is not easy, but seeing as we already did that work, we can provide it, along with the extraction of the data.
As always, thanks for reading this post. Feel free to share so that more people can know that there are many streets that are for people, in the literal sense, because those people walk, cycle, and take transit to get where they need. We can only hope that our work grows those numbers.
