TL;DR
We will be creating maps based on Statistics Canada’s long form survey results, called the Census Profile. It uses the second smallest geographic codes called dissemination areas. We edit those areas to better reflect the built-up area within each dissemination area, but that isn’t perfect, and nor are the areas. We will also Analyze the Statistics Canada Service Proximity Measures data via the smaller dissemination blocks.
Not long enough; want to read all?
As we dive deeper into mapping projects, we will be using Statistics Canada data as a primary source. They collect a robust amount of data through a federally required survey that all Canadians households have to fill out and return. There are commercial and agricultural surveys as well, but this is not a focus of ours. Now within Statistics Canada they have two types of questionnaires. There’s a short form which everybody gets which collects a broad amount of data but doesn’t take too long to fill out. Every Canadian should be familiar with this form. Then there is the long form survey.
To really deeply analyze our population we need to access the data on the census of population questionnaire long form. This survey gets into everything from employment status, languages spoken at home, how you commute to work, the value of your dwelling unit, many bedrooms are in it, how many rooms total are in it, if you rent, how much rent is, how and so much more. There are over 2,000 individual pieces of data that are tracked. There are certain sections in that data that we care more about that others. I mean, feel free to read all of the different chapters Statistics Canada gets into on data collection and sorting, but it is not entertainment by any means.
Ugh… get to some maps!
So why did I just bore you for the last minute? Well it is because the long form survey contains the most interesting data but since it is not given to every citizen there is a certain limit to how small Statistics Canada can make areas get before they become statistically irrelevant. For example if a town only had 100 people and nobody got the long form survey then we can’t really tell anything about that population as it relates to long form questions. Assumptions can be made via extrapolation and interpolation and other statistical means but they aren’t real so Statistics Canada tends to not do that.

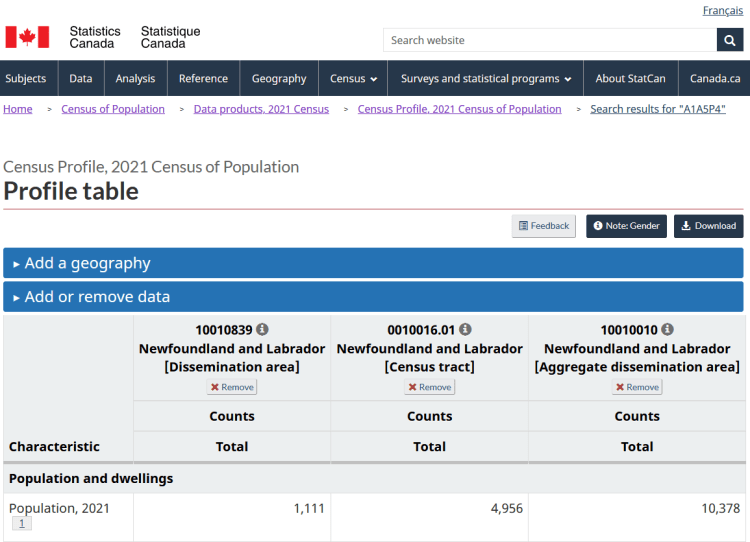
We can lift data for all of the area breakdowns. As you can see on the image, they go from as broad as a province of 17 million people, to little chunks that can have as little as 300 people or so in them. All of Canada is broken down like this and the map is… intense to say the least. Note that these are not necessarily in descending order.
What you will see us doing with Streets are for People are using the Statistics Canada dissemination areas to generate interesting maps. These are the smallest geographic regions where Statistics Canada has high confidence that the data is relatively accurate. It’s difficult to find how many long form surveys are done in each region but it seems to be around 25% of the population.
How It’s Made ©®™
The first logical question is how on earth does Statistics Canada begin to split regions into smaller and smaller parts?
The answer is very complexly. The only thing consistent is that it is not consistent. Some higher levels of geographic codes are not much different than the smallest chunks as there simply might not be enough people to warrant a more complex breakdown. You might have a town like Lumsden as the lower three codes and that is fine, because it is a small town. Whereas a City like St. John’s is broken down in many different ways.


However, as places grow in population, Stats Canada splits regions into smaller chunks. But before learning about why this is important, there are two critical pieces of information you must know:
Codes do not merge, EVER.
Borders do not shift, EVER.
Once a sub geographic code is established, that is that. If everyone moves out of an area, tough luck, the area stays. In a database, you never delete core data identification points. NL Power has thousands of poles that don’t exist anymore. CSJ has manholes long since replaced. Government has roads that are no longer serviced. Companies have employees no longer there. You keep the ID’s because those are key elements in linking sets of data.
Why is that important? Well the whole reason for this post is to explain why many of the borders seem to make no geographic sense as we have already gotten many questions on oddities and it seemed like an explanation was in order before we start making more maps. Like there are other ‘rules’ that Stats Canada uses, but they aren’t really rules. Some of these ‘not rules‘ for splitting up the geographic codes are as follows:
- Shorelines often form boundaries
- Important terrain features form boundaries
- Municipal boundaries form boundaries
- Roads often form boundaries
- Rivers and brooks often form boundaries
- Province borders form boundaries
- The backs of property often form boundaries
- Other government agency regions can form boundaries
The thing is, not all of those are true, except provinces. Municipal boundaries are often true, however if some small rural town in Alberta changes it’s boundary to include some more farmland, it might not be tracked by Statistics Canada. Sometimes a bunch of small islands are part of a region just to ensure all the land is tracked. Sometimes a lake is in the middle of dense area and a line may follow the shore or go up the middle of the lake. All that is to say, those rules are more guideline than rule as it is very difficult to stick to a rigid structure with a country as varied as Canada.
Is it map time?
Now it is time to talk about all the oddities of these Statistics Canada Dissemination Areas. First thing to note is that we edit them. We edit them in a way that doesn’t alter the population, farming, or commercial features, but we do reduce them in size as it just makes no sense to include dozens of square kilometres of wilderness when talking about ‘transit accessibility’ or ‘housing affordability’.
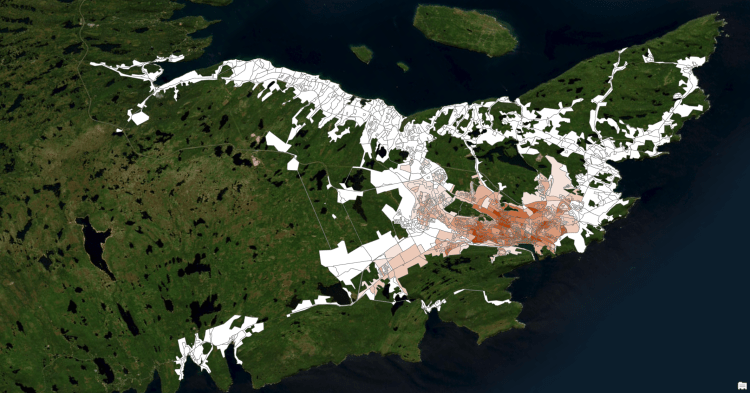
Below is a comparison of ALL the original dissemination areas for the St. John’s Census Metropolitan Area. It is made up of 337 pieces, 2 of which have no people in them. However in general terms, over 70% of the area is empty winderness, and that is mostly contained on the rural satellite exurb towns and the empty vast nothingness that is most of St. John’s.


There is one giant region that should be pointed out. This is the single largest dissemination area in the St. John’s CMA: Galway. Although it was not the most reduced, it often looks the weirdest in our mapping snapshots; at least since December 2023. It is bigger than any other municipality other than St. john’s itself full stop. Not even Holyrood with it’s absolutely massive area comes close to the empty expanse of St. John’s which is nearly a quarter of the entire area of St. John’s.

In the image above note that within that blue-ish selected region (Galway and farms) in the centre of the image, there is a large chunk of grey inside it. That grey is the built-up area as indicated by Streets are for People. I personally edited all of these regions using aerial mapping in an attempt to get to some reasonable representation of the built-up area for the purposes of density but it may have been a poor choice depending on what the purpose of a specific map project is.
See, the whole point of the data in a map is to analyze something. In the case of our Statistics Canada visual project, it is to look at the Census Profile of population and the data collected in the long form survey. We can easily justify removing the wilderness, but other things are less obvious. Having a large amount of farmland really makes no sense, but I’d like to explain why we have no real other method that would work where we can reliably remove things that aren’t population.
See, if I start cleaving farmland out by the Goulds/Galway, what is the line we draw? Do we snake around the farm with some really silly borders and simply include the house on the farm? How do we decide which house is a house, and which is a barn? Also, if we start to cut out commercial and industrial space, then how fine do we go? Should we cut out the Avalon Mall? What about corner stores and parks? The answer is we simply cannot expend that kind of time into cutting the dissemination areas into population only zones.
So for now, or until we get some other method of cleaving expanses of residential land from the Statistics Canada dissemination areas, what we have is the best we can do with the resources available.
Mostly maps now
Now there is an even smaller geographic code that Stats Canada uses. It is called the dissemination block. These are much smaller again, dropping to as low as a population of 40 people. However the long form survey does NOT apply to these regions as they become statistically inaccurate (noted earlier in this post). However, if they did track long form survey data, it would be a lot more accurate and easier for us to modify, as these regions tend to be much smaller and thus cross over far less different land use types. Though again, they do not track long form survey data in the smaller dissemination blocks.

So even though we cannot use the smaller dissemination blocks (smaller than areas) for long form survey data, we can use it for other data that Statistics Canada tracks, like proximity to public transit, and schools. This is known as the Service Proximity Measures data. We won’t be able to do in depth analysis using the long form survey, but service proximity is useful in and of itself.
As noted earlier, these dissemination regions (areas and blocks) often form weird boundaries, as noted previously. In the image above, you might have noticed that the north side of Thorburn road shows up as having some sort of transit access, despite no bus going there. That is assuming you can zoom in on the image. Well the reason for that will be more illuminated in the image below.
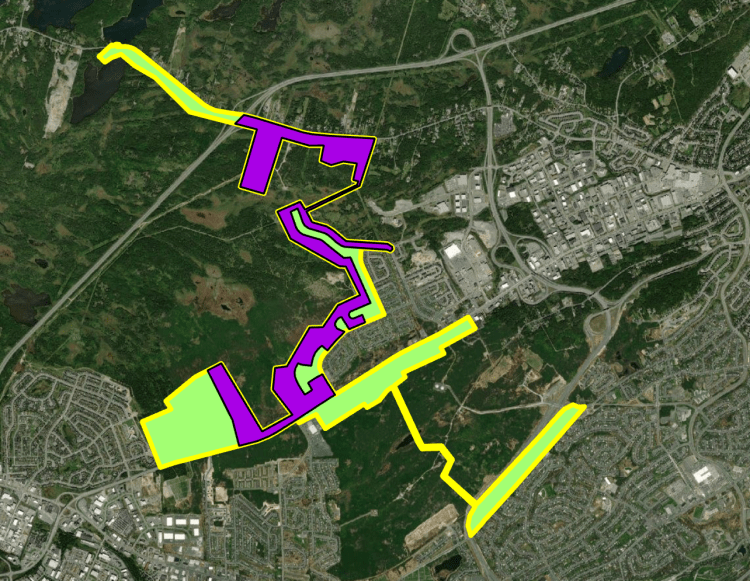
There is a rather large dissemination region that follows the border of Portugal Cove-St. Phillips and Paradise, and splits down the middle of some roads. At the time of the last survey (2021) Statistics Canada had not chopped this region into a smaller piece which leads to the very rural wealthy homes along Thorburn Road being lopped in with middle class single detached homes of Kenmount Terrace.
So in the example above, if we were to look at median house price, the lowest code we can use is the large (green) dissemination area. Whereas if we looked at access to transit, the lowest code we could use is the smaller (purple) dissemination block. On one hand, it would make the whole area’s house prices look more like Kenmount Terrance, but also make Thorburn road’s rural segment look like it has some bus access. In the end, we can only work the the data we have and the areas provided.

I just wanted to go over a couple more things regarding the way Statistics Canada splits up areas into smaller blocks. Above, you’ll see the dissemination areas (larger) with yellow boundaries, and dissemination blocks (smaller) in pink with black internal boundaries. What to note here is that some diss-areas are split into nearly a dozen or more diss-blocks while others only split twice. This is more or less in line with population density. The higher densities get more splits. Those splits happen almost entirely along roads in the more urban regions.
Since the original larger highlighted diss-areas started getting split into more and more blocks, the baked in higher order code for the lower order diss-blocks cannot change. So in the case of these higher density areas, they may simply keep cutting them into more diss-blocks are required, but the diss-area will just have more and more population. A concerted effort by Statistics Canada would need to be taken in order to ensure some planning of the lower order locations has the ability to grow correctly.
The areas can and have be re-coded by Statistics Canada, it just makes some comparisons a little more complex. There is a much longer code that is for each block that seems to have much better flexibility, but at least in our neck of the woods, I see no data suggesting any diss-blocks have changed their root diss-area.
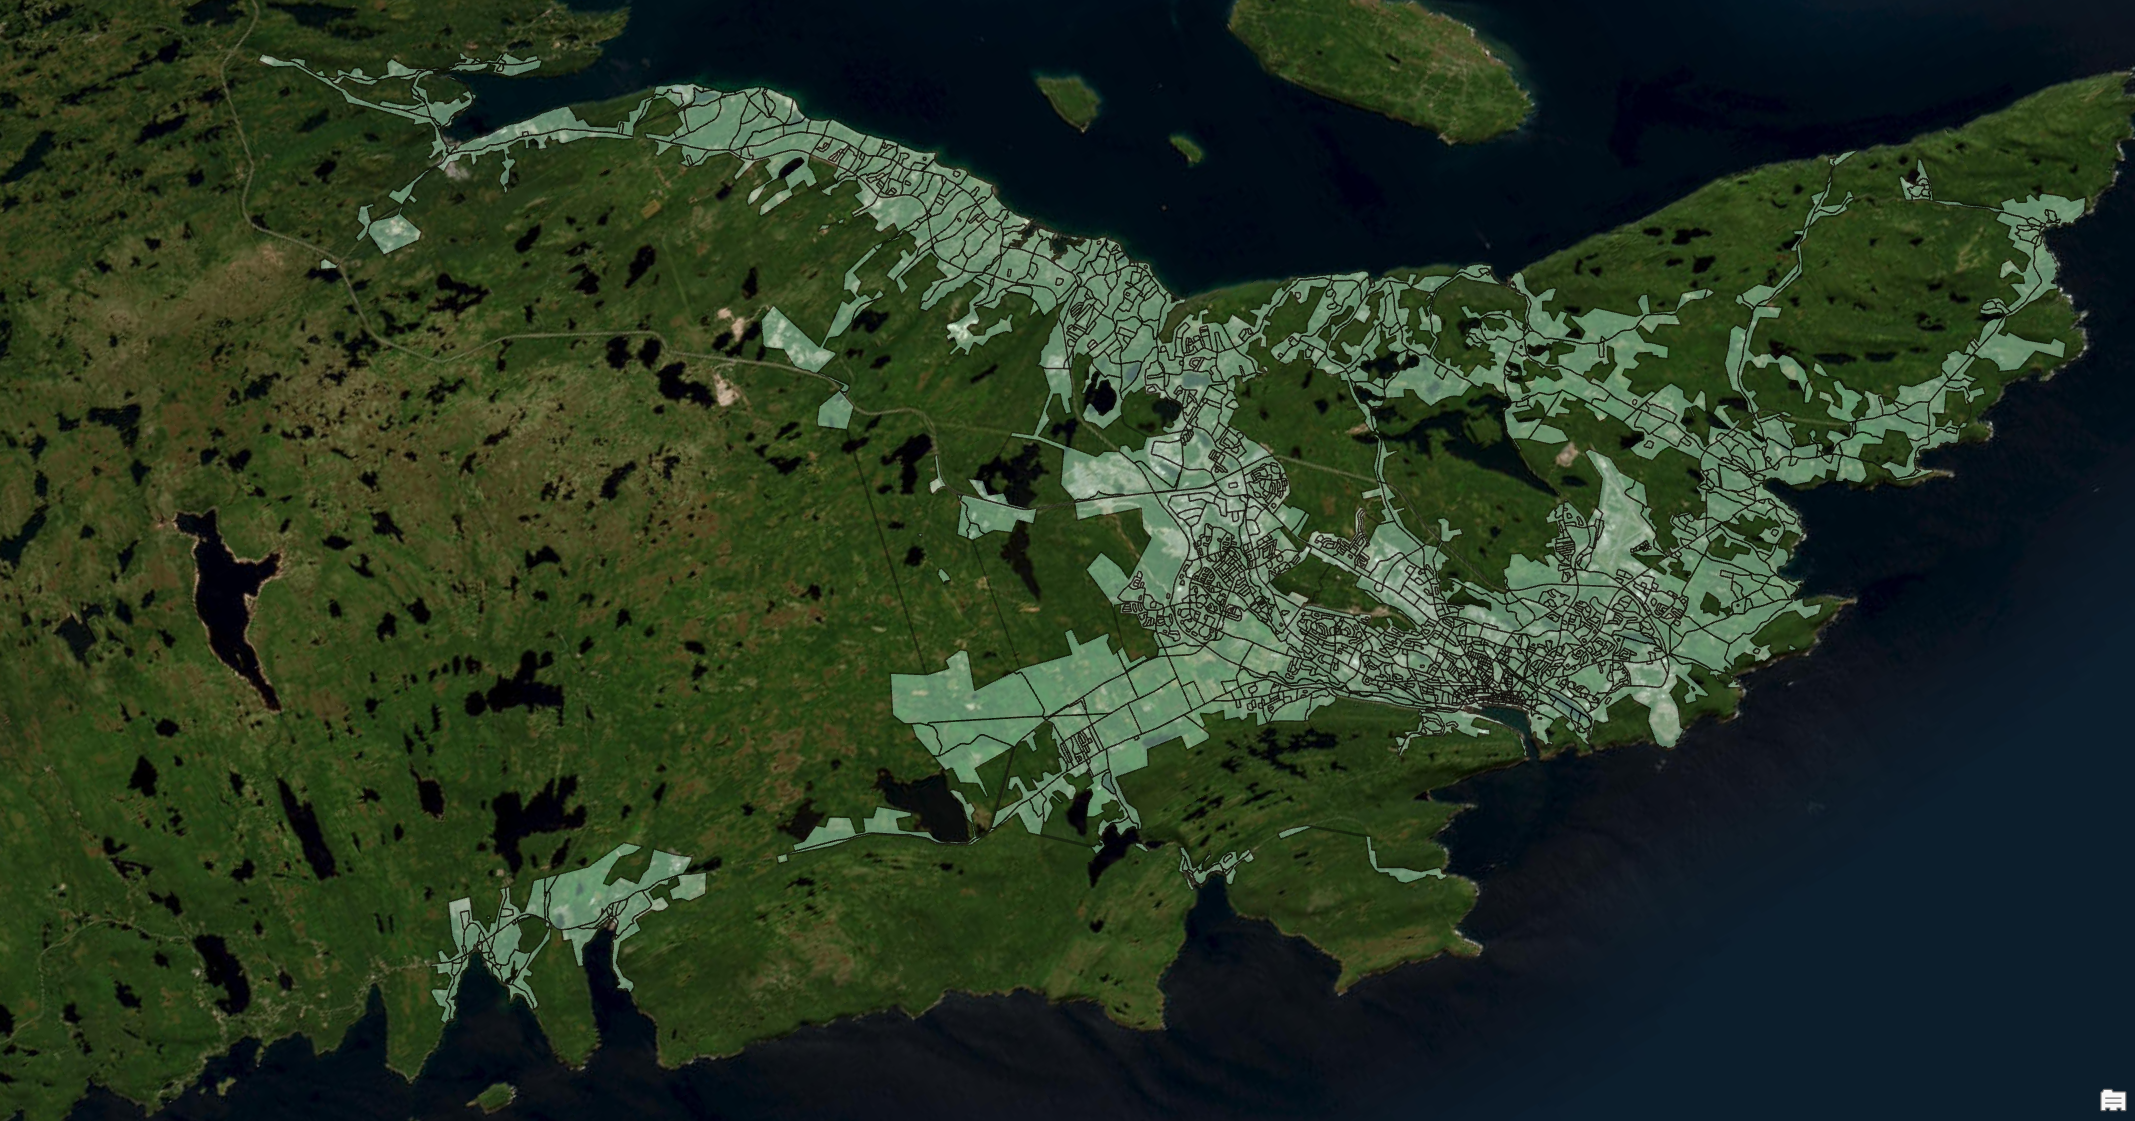
Okay one more simple map. This is simply a comparison of the original Statistics Canada dissemination blocks (smaller units) geometry, and our updated built-up area modified geometry. The overall limits are the same as for our updated built-up area geometry for the dissemination areas (larger units).

This isn’t a very ‘streets’ related post. Statistics Canada has plenty of metrics tracked and we intend to explore them in interesting ways. We will use those maps to help illuminate issues with service access, population demographic data, back up other portions of our data base, and more. In the end, we hope that looking at Statistics Canada data on the population and then looking at more local access to services, we will help show how streets are for people. Nailed it.

One thought on “Stats Canada Dissemi-what nows?”